Project Study
Name: Issa Fares
Date: 2024-19-01
Contact: faresissa22@gmail.com
1.0 Introduction
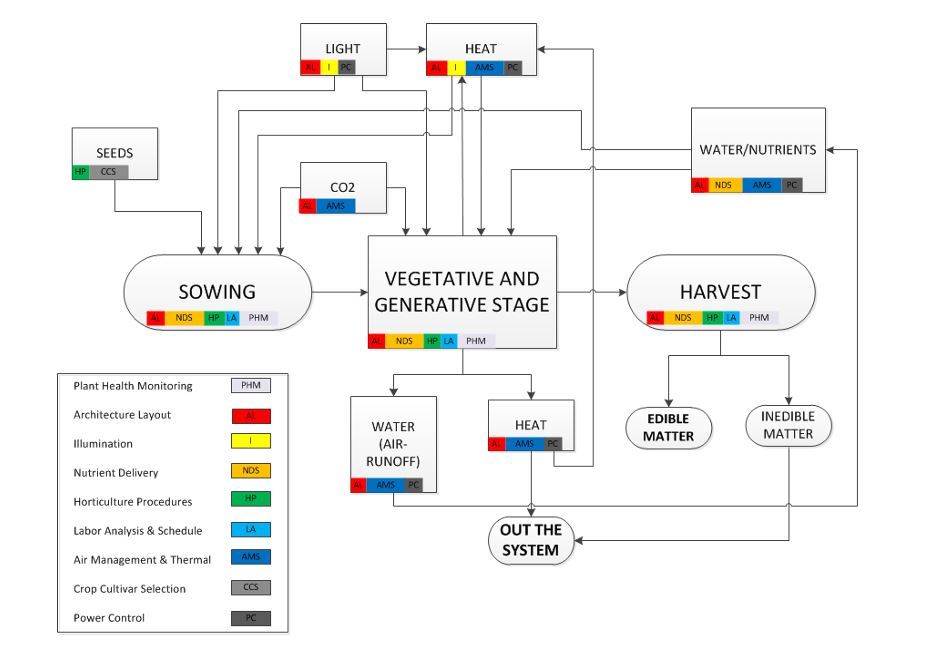
In the following report, the theoretical implementation of a leafy green vertical farm is discussed and analyzed. the general design flow includes: the plant production process, the climate management components, nutrition delivery system (NDS) elements and, the structure itself. Inputs into the system include: seeds, energy (light & heat/cooling), carbon dioxide and irrigation water with nutrients. The returned intermediate outputs, are the water coming from the runoff or the reclaimed water vapor and the heat surplus in the air management system (AMS). The final outputs obtained through the harvest are inedible matter (waste) and edible matter (product).
The separate subsystem chapters include the detailed analysis of the lighting requirements, climatic requirements, horticulture processes, and power consumption analysis among others. Each of the subsystems is related to a part of the general process flow. Each subsystem needs to be complemented by the others. An example can be found in the vegetative and generative stage element where most of the systems connect, either through associated elements or the element itself.
2.0 Architecture Layout
2.1 Modular Design
The baseline design resulted in 5 warehouses that each measures 75 m by 35 m. 4 of which are cultivation modules, with a singular central convergence warehouse acting as the hub. each cultivation module is divided into two general areas: the core and the production area separated by decontamination airlock. Each of the modules measures 6 m floor-to-ceiling. The overall footprint of the projects is 13,125 m².
2.2 Central Hub Description
The central hub area comprises of the main entrance, a room for staff, the fresh water unit and storage tank, the main control room for all the modules and the main decontamination airlock. The main airlock also contains the changing and decontamination rooms for employees which provides the first level of separation between the cultivation area and any contaminants from the outside or core areas
There are 10 cold storage rooms, each one 5 m by 4 m, located in the middle of
the central hub floor, five on each side. Each storage rooms can store a full
harvest from a single module each day, 21 pallets (2,040 kg) of lettuce.
The rooms have to maintain a minimum temperature of 2°C and a relative humidity
between 90 - 95 %.
A second exit allows product to be transported from the cold storage to transport trucks. A small vestibule of three meters is between the cold storage rooms and the truck gate. The vestibule creates an air buffer between the outside and the refrigerated area, which will minimize the inflow of warm air into the cold storage area. Outside the core area are large water buffer tanks and CO2 tanks which serve the various cultivation modules.
2.3 Cultivation module description
on the low floor,the module houses the bulk nutrient solution storage (NDS) tank and mixing unit, a germination room, the module airlock and a packaging room as well as the utility lines connected to the central hub.
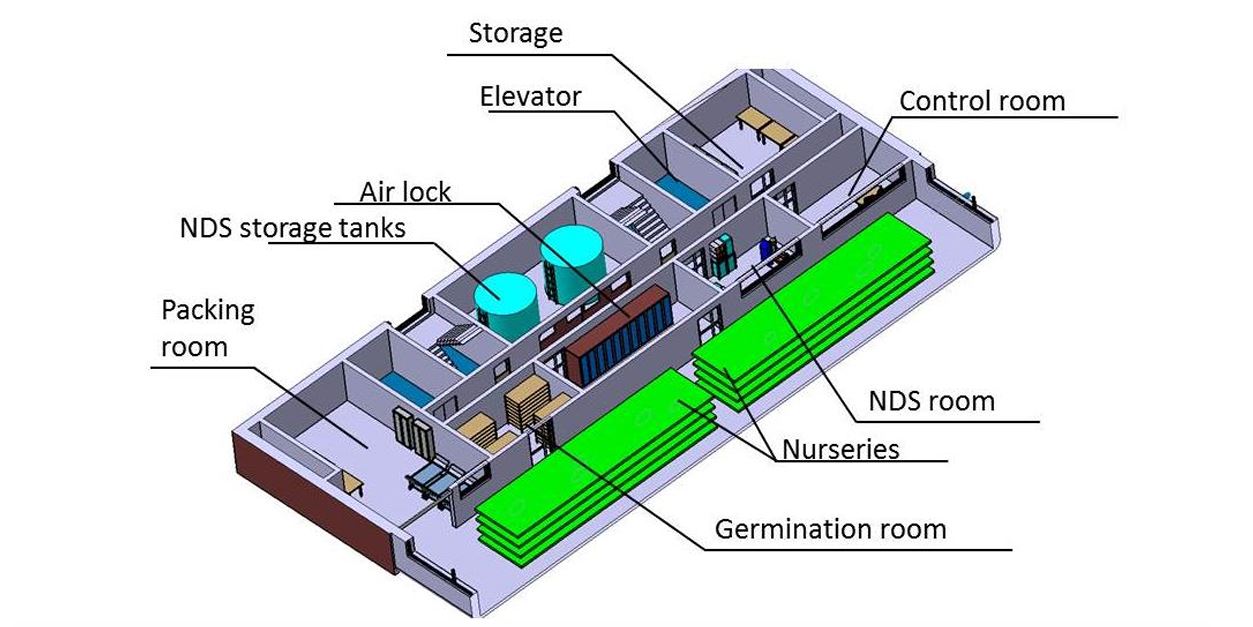
On top of the germination room, airlock and NDS room the air management, thermal, power control and distribution system components are housed. Detailed descriptions of each of the subsystems and their respective components are in the dedicated subsystem chapters in this report. The production area is divided into the working area, containing the nurseries, and the cultivation area, where the growth racks are placed. The working space measures four meters in length. Here, the workers have space to harvest, clean and plant gutters which will then be trans ported to their appropriate areas for the start of the growth cycle. This area will additionally provide space for the workers to package the incoming produce to be shipped away. The two nurseries are located near the core and measure 3 m wide by 13 m long and are stacked five layers high. The total nursery area per module is therefore 390 m².
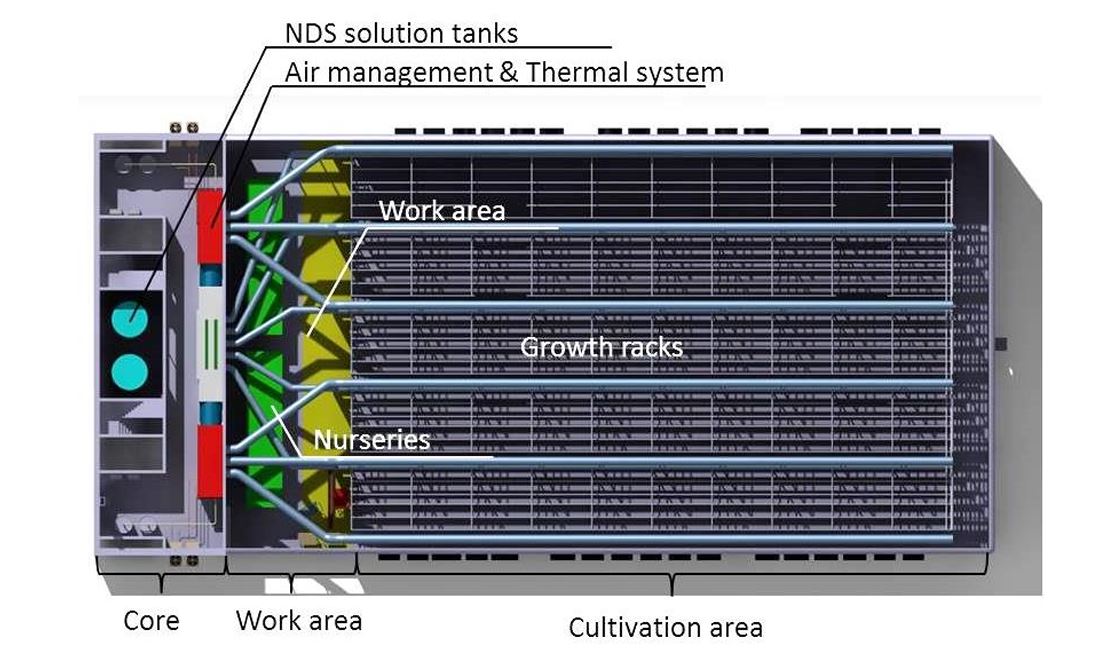
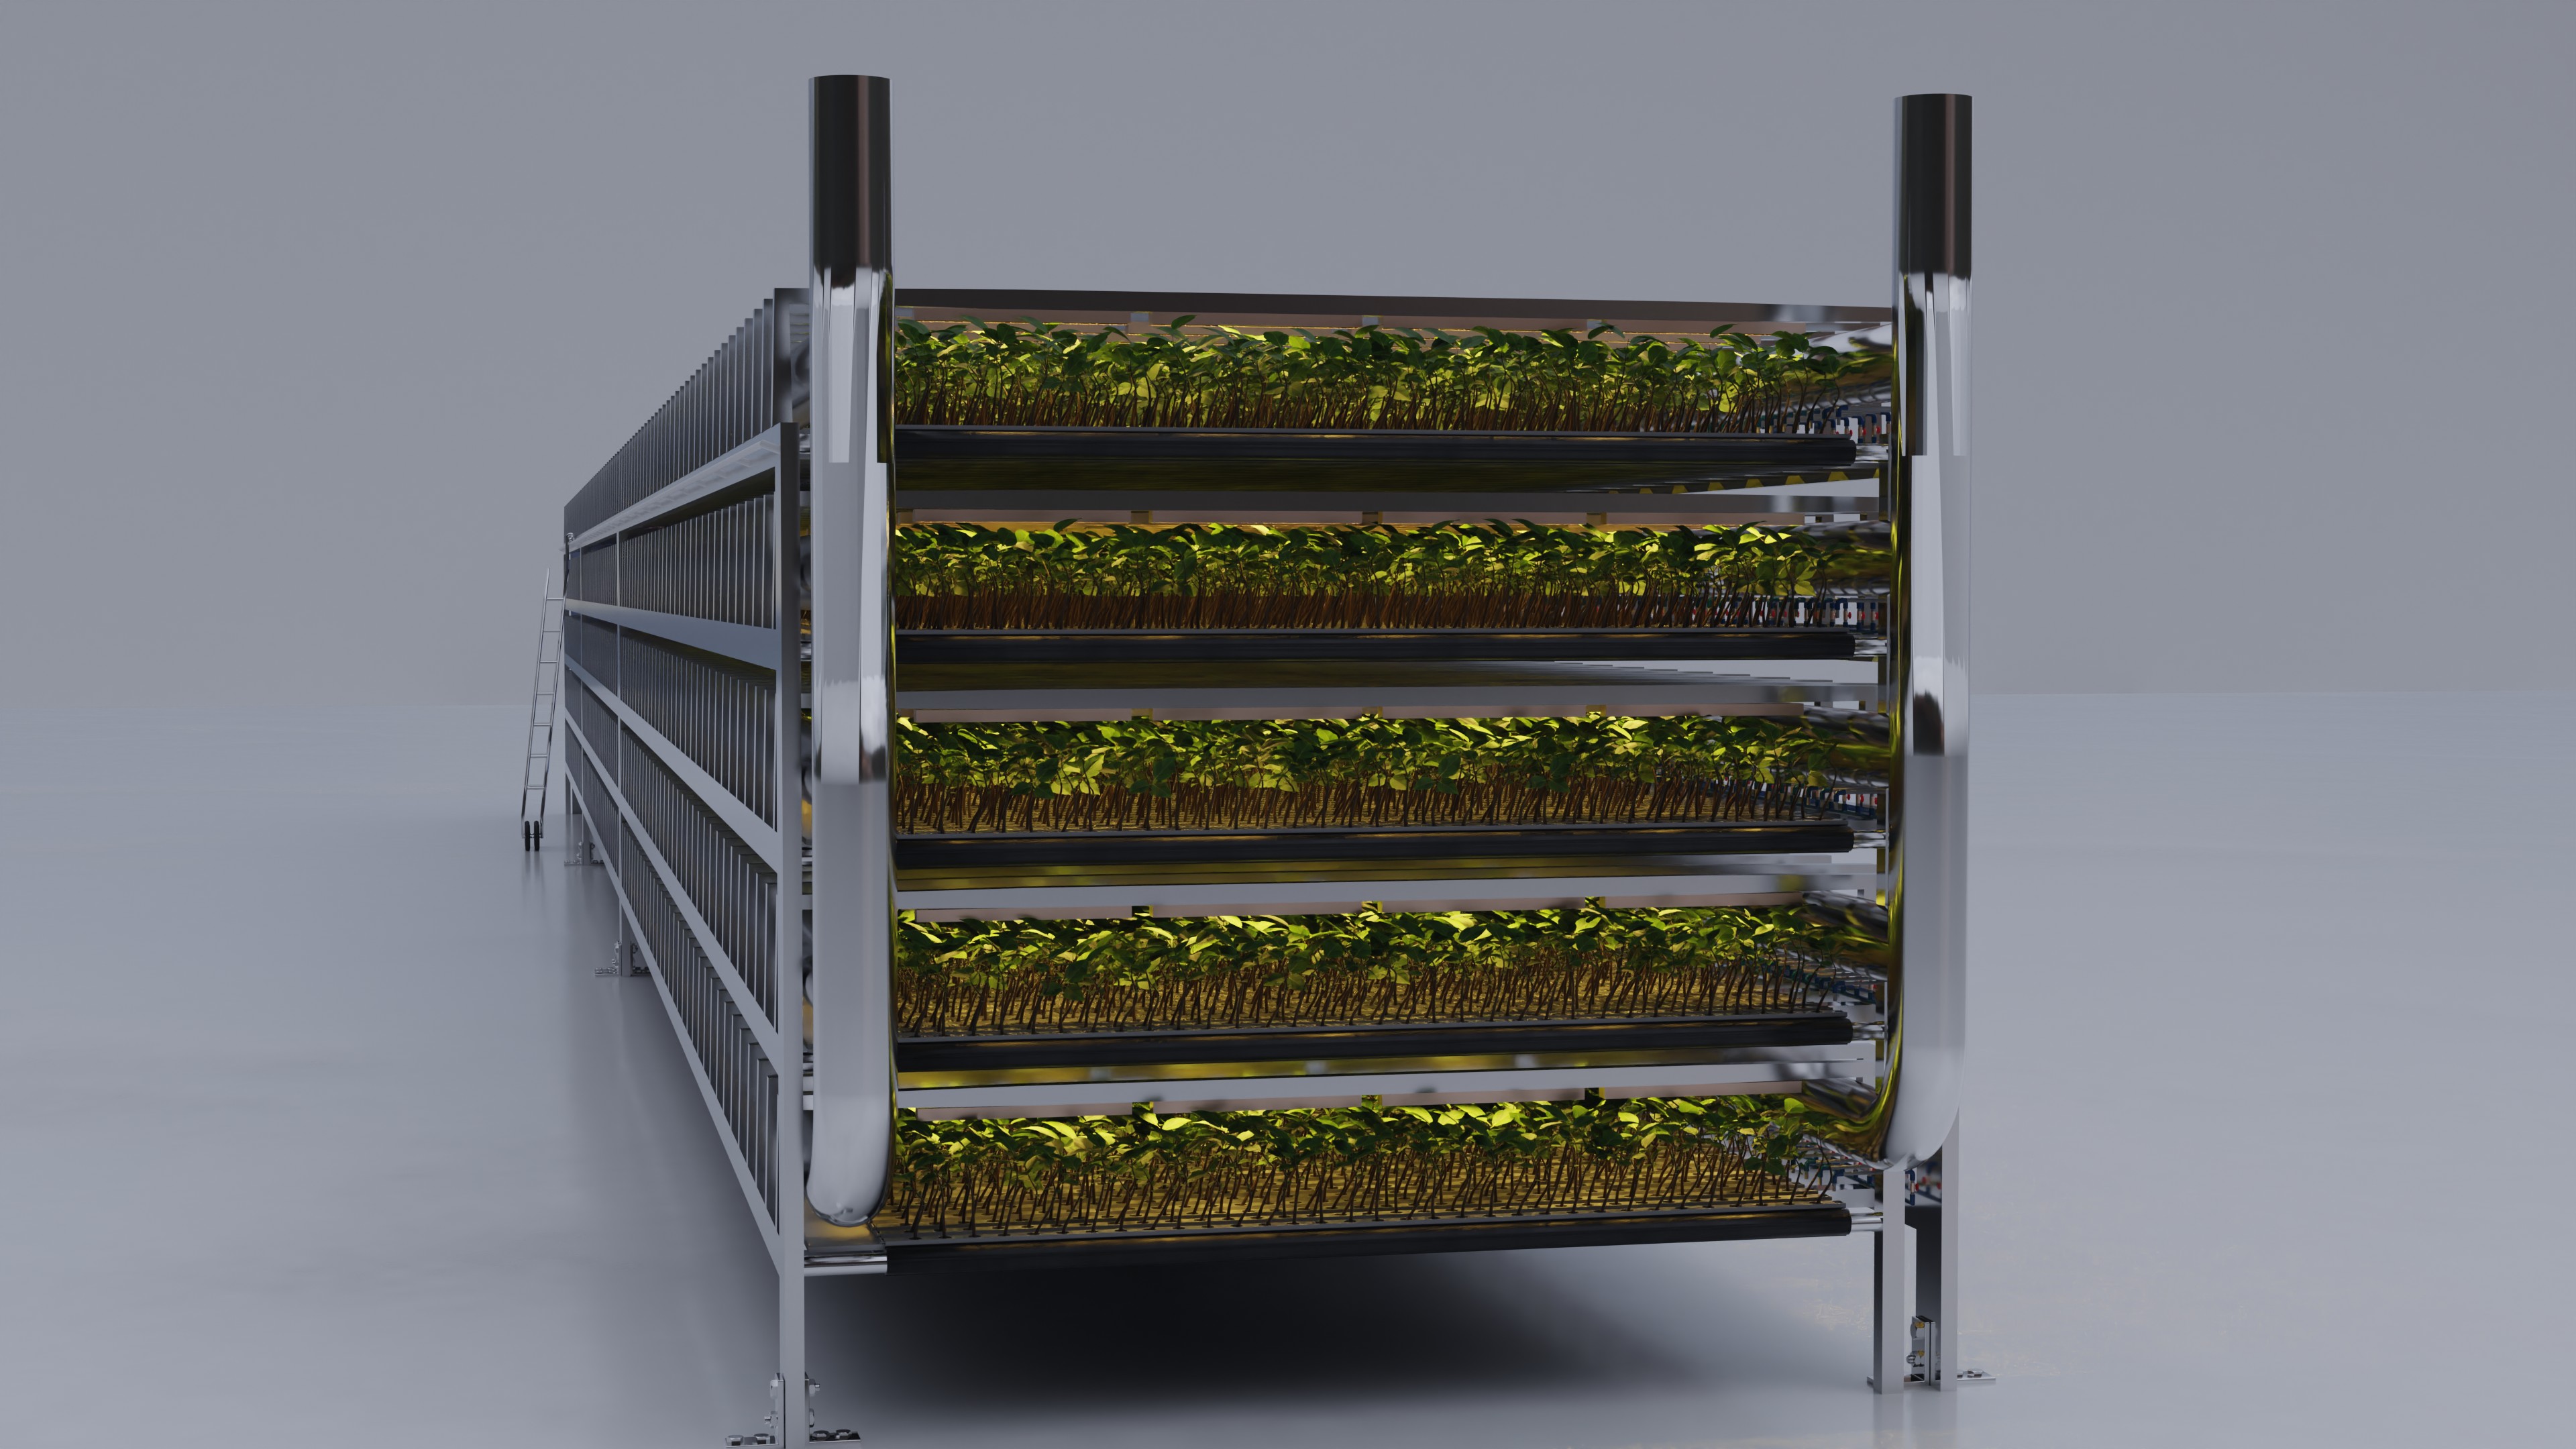
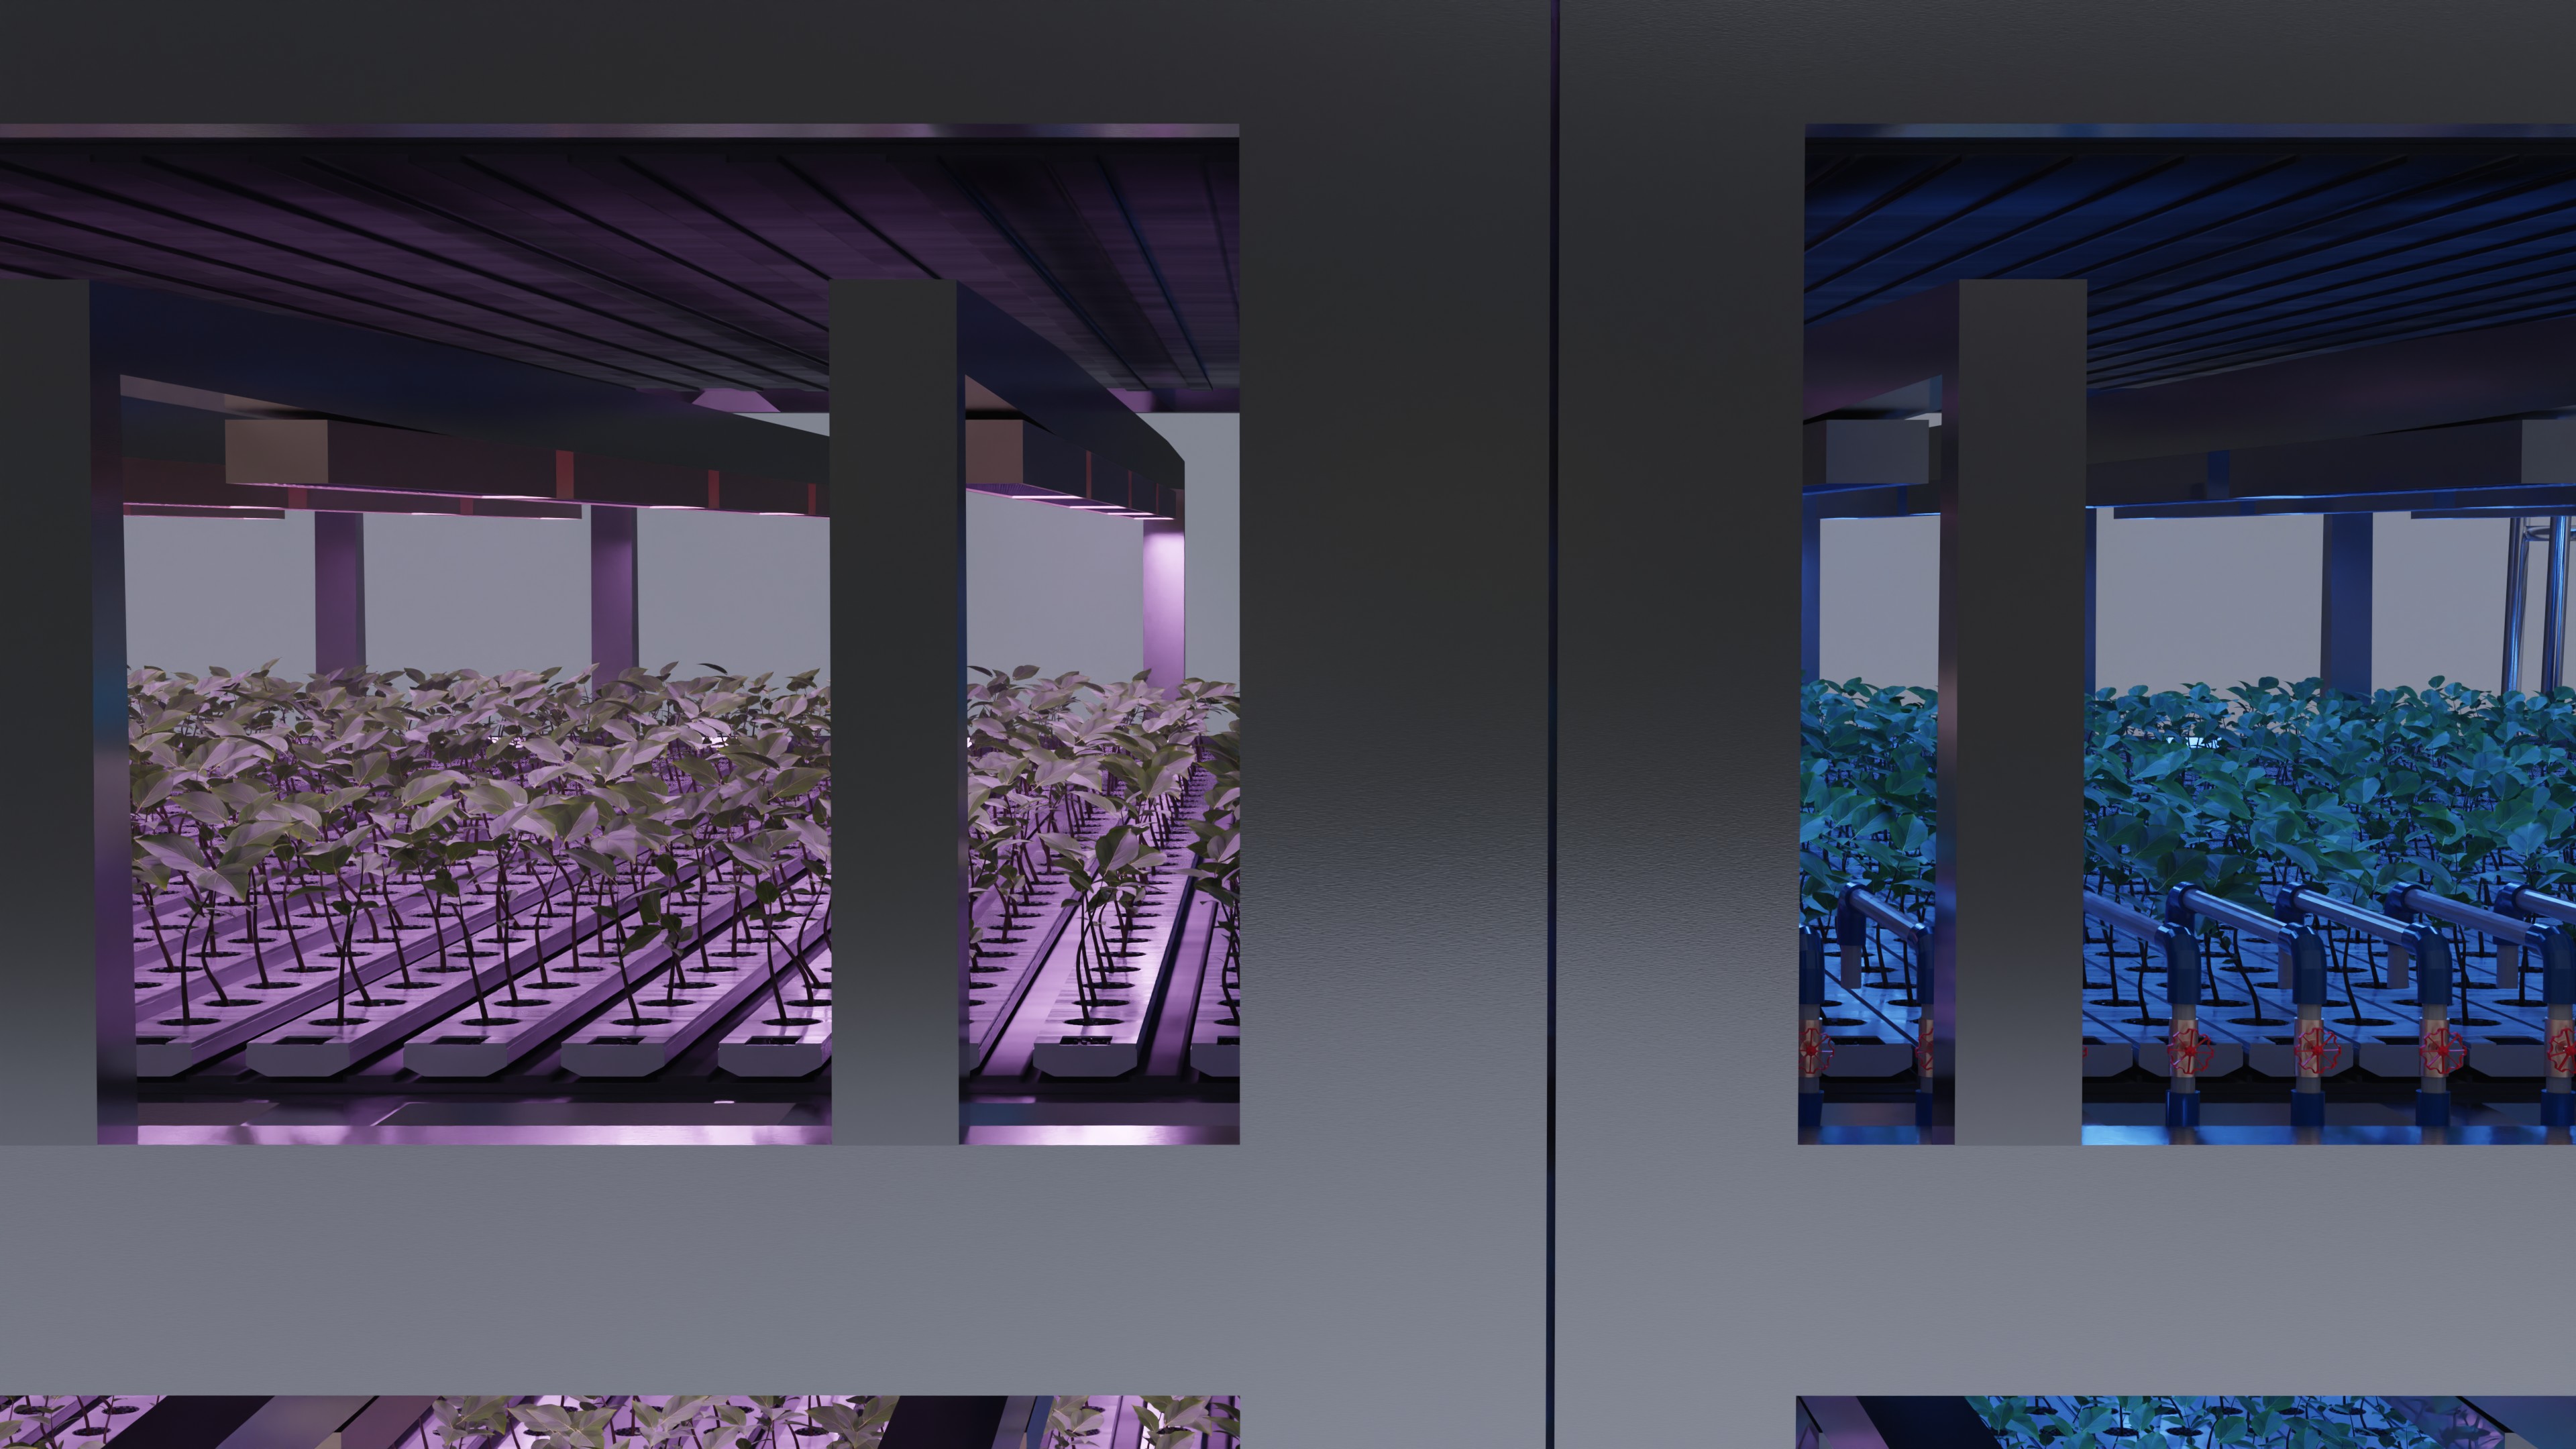
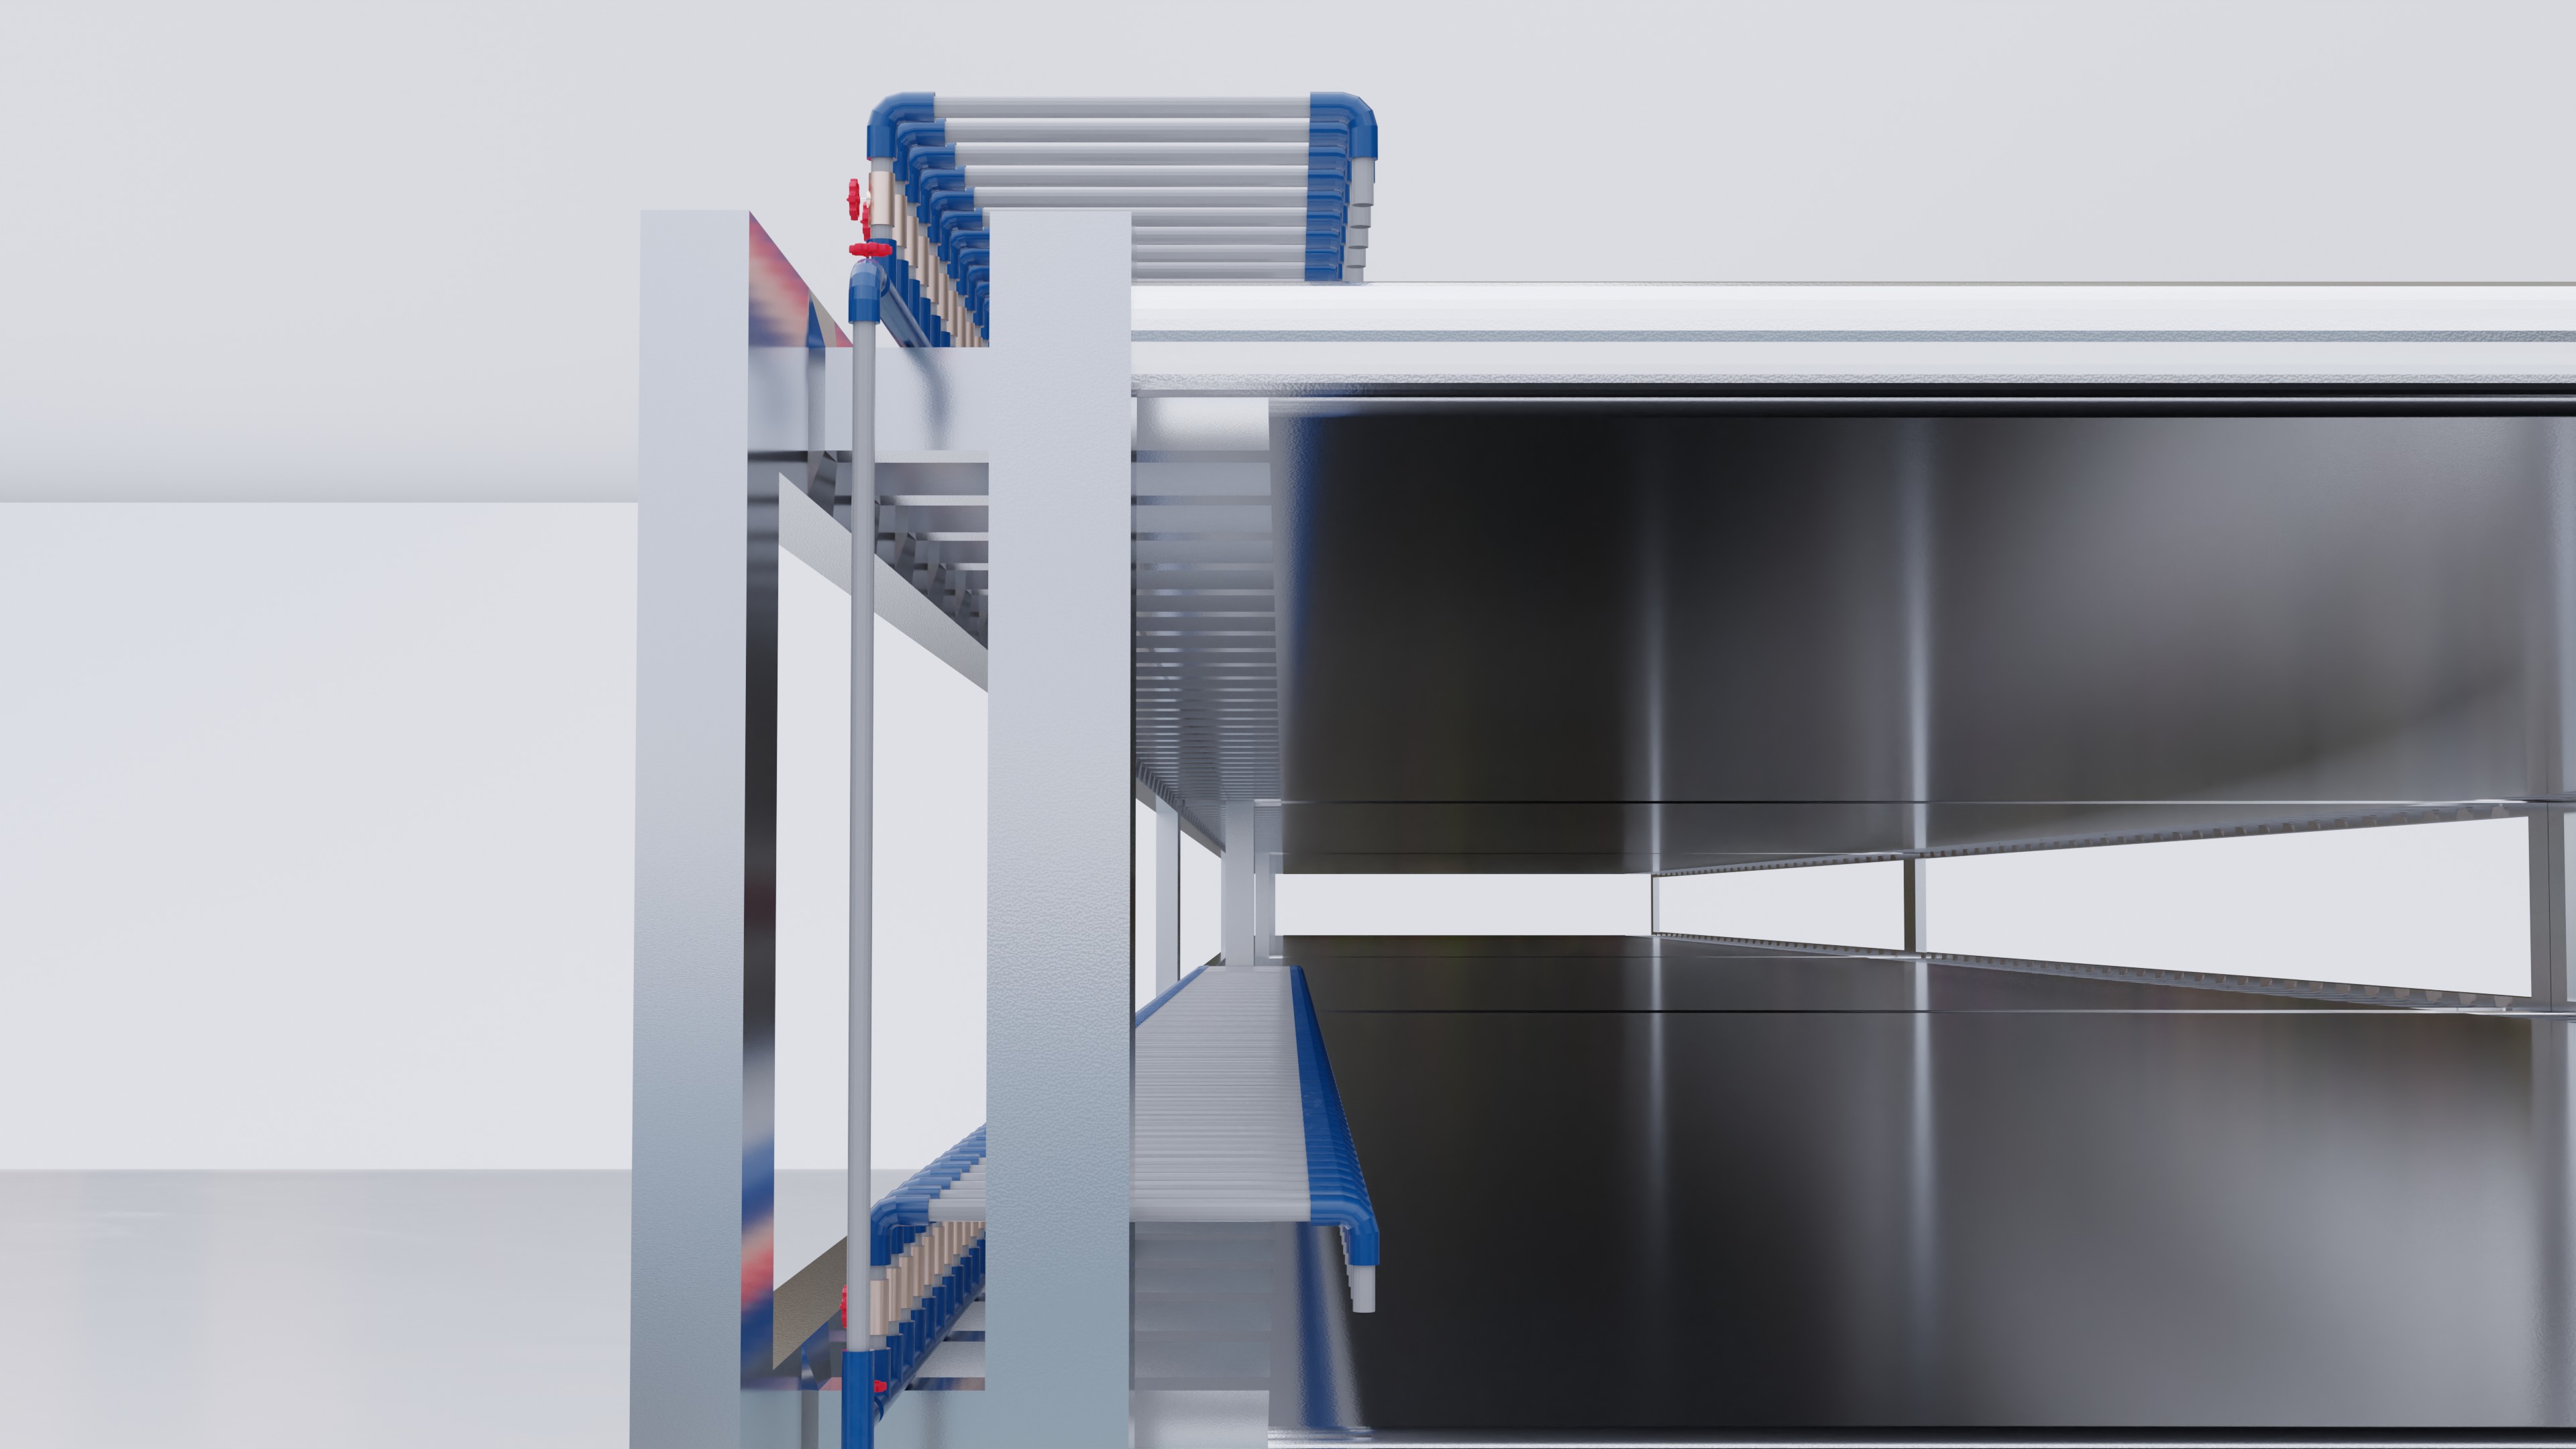
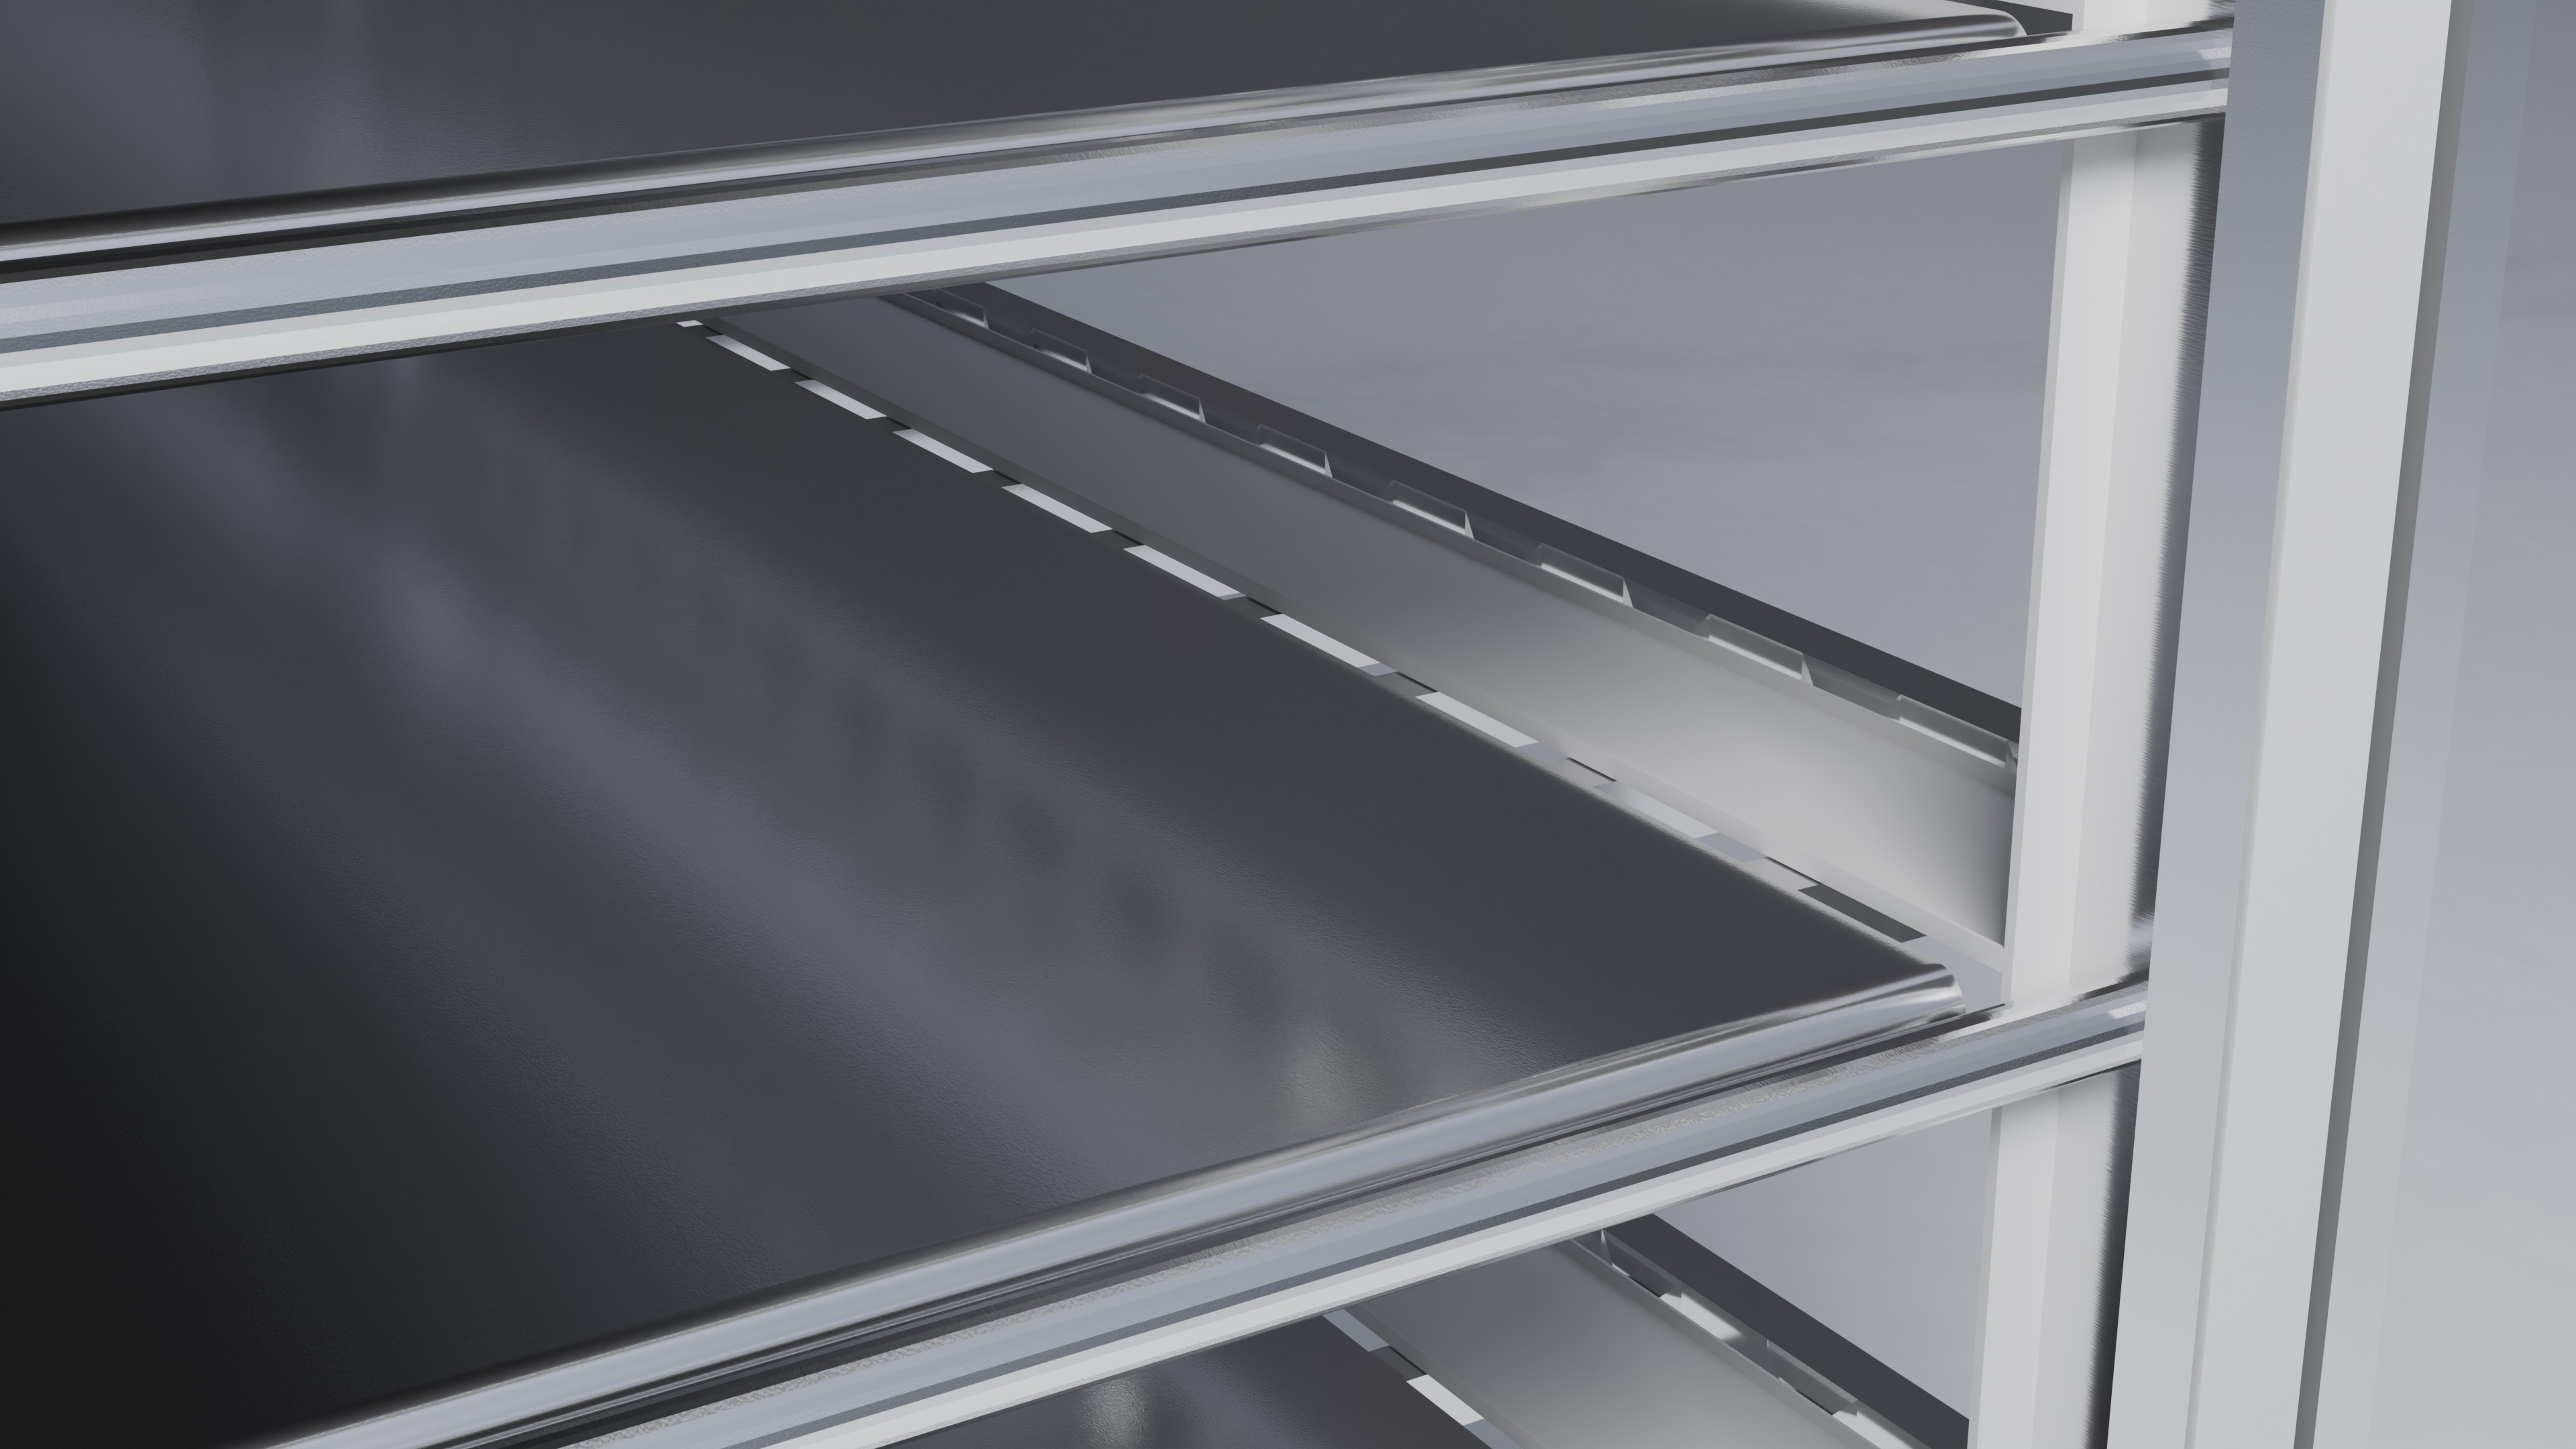
The cultivation area contains five gutter growth racks, with each rack being 50 m long and 5 m wide . The total height of the growth rack is 6 m, which is the entire floor-to-ceiling height in the cultivation area. Each rack is divided into five, 1 m high growing compartments. The compartments are each equipped with a drain, an irrigation pipe with individual drippers, and at the top of each compartment, LED panels are placed.
The lettuce heads will be in 5 m long gutters, moving on the growth track.
The germination room, located in the core of the lettuce module, will be the starting point for
seeding. Following successful germination, the young seedlings move to the nurseries in the work
area of the lettuce module. The lettuce is transplanted from the nursery into the gutters upon
maturity. Lettuce plants are planted 15 cm apart, allowing 33 plants per gutter.


3.0 Horticulture Procedures
The total life cycle for lettuce is 48 days from the seed to harvest. Germination takes place in the
germination rooms under germination specific conditions. The seedlings then spend
14 days in the nurseries before they are transplanted out into the main gutter growth system.
Lettuce will spend a total of 28 days maturing in the primary gutter system. These 28 days are divided
up into three distinct phases differing mainly in light intensities. Each of the five
levels within the five cultivation racks will act as an independent growing system
containing all the necessary lighting conditions to produce fully mature lettuce as they move down
the length of the grow rack. Mature head of lettuce are ready to harvest when it reaches an edible
fresh weight of approximately 200 g.
| Stage | Days | Temperature [°C] | Relative Humidity [%] | Light In- tensity [μmol/²/s] | CO2 [ppm] | Wind speed [m/s] |
|---|---|---|---|---|---|---|
| Germination Phase 1 [Germination room] | 1,5 - 2 | 22 | 95 | 150 | 1.0 | 0,3-0,5 |
| Germination Phase 2 [Nurseries] | 14 | 22 | 80 | 200 | 1.0 | 0,3-0,5 |
| Growth Phase 1 | 10 | 23 | 80 | 200 | 1.0 | 0,3-0,5 |
| Growth Phase 2 | 9 | 23 | 80 | 225 | 1.0 | 0,3-0,5 |
| Growth Phase 3 | 9 | 23 | 80 | 250 | 1.0 | 0,3-0,5 |
Plants from the nurseries are transplanted into the gutters by workers, with the facility running at full
capacity, they will need to replant 308 gutters per module per day. Gutters are 5 m in length and 0.1 m in width. Plants
are spaced 0.15 m from center of planting hole to center of the following planting hole. This spacing
allows for thirty-three plants to be planted per gutter.
Plants will mature and be ready for daily harvest in twelve gutter batches. Each day workers will
collect gutters from each growth rack level and replace at the other end with newly transplanted
gutters. The gutters in the level then shift up to fill the space created by the day´s harvest.
Growth phase 1 is 12.2 m long and has gutters packed with no spacing be
tween them, resulting in a plant density of 66 pl/m². This stage will last for a total of ten days. Fol
lowing this stage the gutters will move into the middle section, which is
15,7 m long and has the gutters spaced at 5 cm, which results in a plant density of 44 pl/m².
This stage lasts nine days. The third and final stage, is 22 m long and increases
the spacing between the gutters to 10 cm resulting in a final harvesting density of 33 pl/m².
The gutters spend a total of nine days in this section before they are ready to be harvested.
This level of production will produce a maximum of 2,029.5 kg of edible mass per day per module. This level of production will allow each
square meter of growing area to produce 146.5 kg of edible produce per year per module. Calculating the Harvest
Index (HI) of a crop looks at the ratio of edible mass to the inedible mass. For lettuce the HI is 0,85,
assuming a uniform distribution of cellular water, this will result in the production of 304.4 kg of inedible mass per day per module.
The lettuce is packed in boxes of 0.24 m² (dimensions 40 x 60 x 20 cm), each box contains twelve
heads of lettuce. There will be four boxes arranged in a standard EPAL pallet (80 cm x 120 cm). Each
box will weigh approximately 2.4 kg, and will be stacked twelve boxes high. This results in a total of
forty boxes per pallet, with a total pallet weight of 96 kg. The total production will be approximately
twenty one pallets per day per module. Inedible matter is sent to the central hub through a chute to be pro
cessed outside the project.
Gutters are washed following each use using a mobile gutter washing system to keep them free from
any buildup of algae or other biological waste/growth that could promote plant pathogens from entering the facility.
| Operational Elements | Units |
|---|---|
| Nurseries | 2.0 |
| Gutter Rack Structure** | 257259.0 |
| Gutter Rack Controller and Motors | 18.0 |
| Washing Machine | 1.0 |
| Germination Racks | 1.0 |
| Production Elements | |
| Rockwool Cubes and Cups | 353400.0 |
| Waste Transport* | 5000.0 |
| Gutters | 10000.0 |
| Pallets for Transport | 2000.0 |
| Trolleys | 3.0 |
| Packing Tables | 3.0 |
| Plastic Wrappers* | 5.0 |
| Spares, Consumables, Tools | |
4.0 Nutrient Delivery System
This section describes the Nutrient Delivery System (NDS)>. The irrigation method used is a Nutrient Film Technique (NFT) system. A detailed description of the nutrient flow in the cultivation system is given for each of the modules. All calculations and requirements are based on the capturing of water produced during crop transpiration; all transpired water is reclaimed through dehumidification in the air management system and sent back into the system.
4.1 Baseline Design
The system was developed to be a closed loop design. Located in the core of each
module is the subsystem. Water from the fresh water tank with the addition of the water reclaimed
from plant transpiration is pumped into the stock solution tanks (Solution A Tank and Solution B
Tank). A Priva Nutrijet system is utilized to control the flow of water from the fresh
water tank, the addition of solutions from both tank A and B and the acid and base control to ensure
an optimal nutrient solution in the Mixing Tank. By using two stock solutions (A and B) the nutrient
balance can be maintained for a longer period of time. Electric Conductivity (EC) and pH sensors are
placed at the junction of the incoming fresh water and the mixing tank of the injection system to
assess fresh water quality. These sensors are also placed in a separate loop coming from the mixing
tank before the nutrients are distributed to the cultivation system to ensure the proper dosage.
Sand and fine filters are placed before the distribution and a flow meter is used to make sure the
system is working correctly.
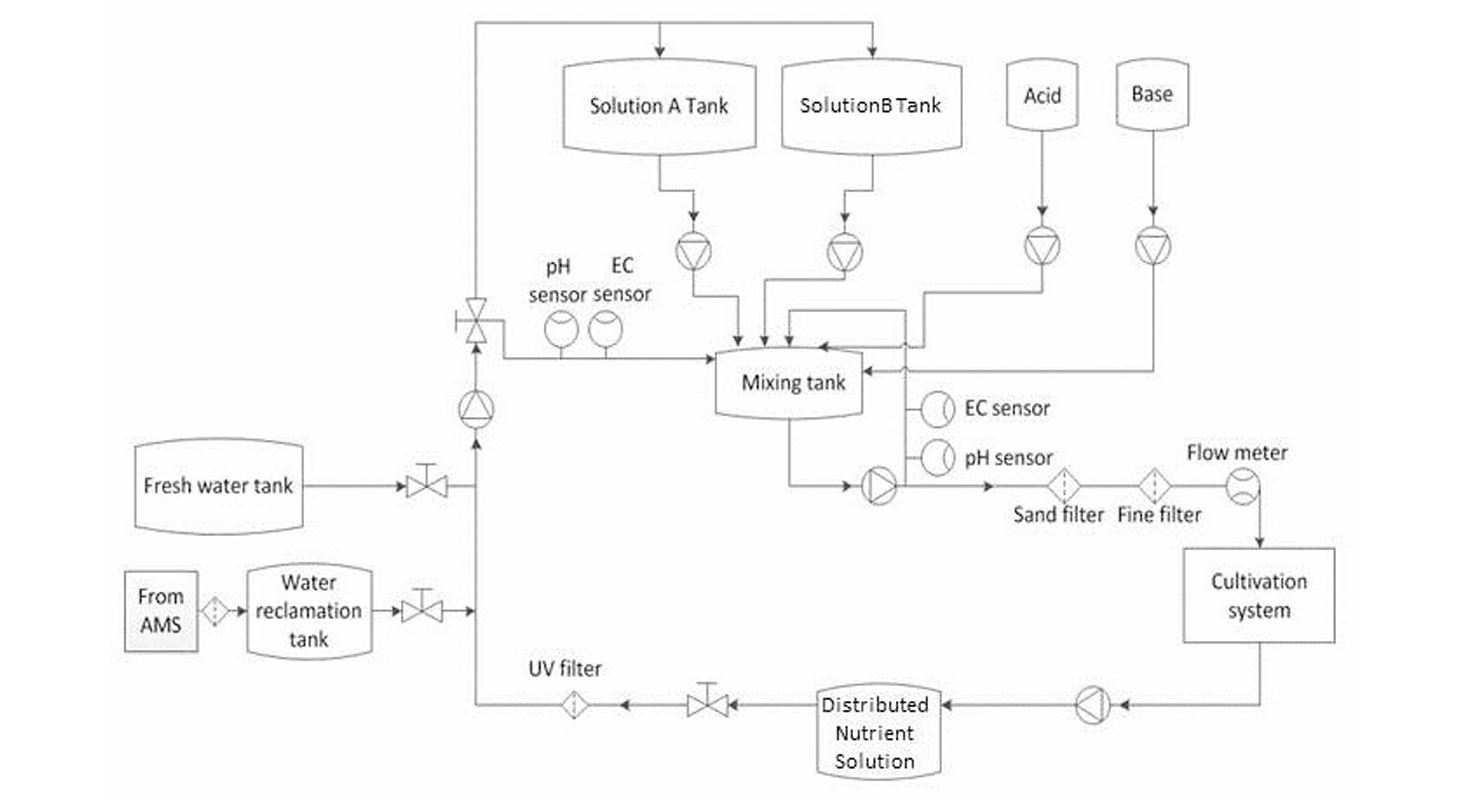
After irrigating the plants, the nutrient solution is pumped through UV sterilization treatment and into distributed nutrient solution buffer tanks. The incoming fresh water only tops off distributed nutrient solution buffer tanks which empty slowly through plant activity and any leaks or grower activities. The bulk solution tanks and mixing computer system are placed in the NDS room located in the core of the module, clean access (from inside the plant growth area) is provided to this room. The two fresh water tanks in the central hub are set to be 150 m³ to allow for expansion of modular production of the Vertical Farm without new investment, which supplies enough fresh water needed for all the initial modules.
The baseline nutrient solution is designed following comprehensive analyses of the supply water to factor in native minerals and pH levels. Over time, the nutrient solution inside the system will be come unbalanced. The rate of nutrient absorption by the plants may change for different ions, and the lack of individual ions cannot be restored using a dual stock solution system. This can be solved by analyzing the time it takes for an important imbalance in the nutrient solution to occur and flush ing the system completely. The nutrient solution is restored approximately every six months.
4.1.1 Gutter System, Lettuce, Irrigation
The initial calculations for the irrigation needs of the system were based on the transpiration rate of the mature crop. For a fully grown lettuce, the transpiration rate is 3 liter per m² per day, and a wa ter buffer of 27 liter per m² per day was assumed. For a 5,000 m² cultivation area, this amounts to 150 m³ per day or 30 liter per m² per day for each lettuce module. The distributed nutrient solution tanks are 75m³ (75,000 liter) per module. Each growth rack is divided into five growth levels of one meter each, each equipped with a drain and an irrigation pipe with individual drippers. Irrigation is suspended above each channel to allow for mobility of the gutters. Drainage channels leading to the reservoirs are present underneath the drain side to capture the solution. Each grow unit has a dedicated 845 W pump for irrigation, with an irrigation cycle of 5 minutes on, 10 minutes off, throughout the day. By staggering irrigation cycles between racks, it allows for a smaller distributed nutrient solution tank size.
Each of the dripper manifolds was assumed to work with 2 bars of pressure at the inlet and was sized at 16/13.6 mm (outer/inner diameter). Pressure losses due to elbows and tee flows are taken into account. The maximum velocity inside the pipes was 2.2 m/s and a design pressure of 1.72 bar was used. The calculation resulted in a 2 meter distribution inlet line per rack of 69.5 mm Ø (2 ½ inch) and 1 meter sections of 84.6 mm Ø (3 inch) and 108 mm Ø (4 inch) each. The main distribution line pressure and velocity allows for the use of only 108 mm Ø (4 inch) pipes, approximately 50 meters long. The return pipe length was estimated in 60 meters.
5.0 Illumination System
The analysis of the lighting system is of great importance. It significantly affects the energy consumption of the project, both due to the quantity of lights and duration of the photoperiod, and due to its effects on the thermal load within the project.Lighting design influences the photosynthesis rate of the crop, which impacts the final marketable yield. This section addresses the types of lighting systems required for the illumination of the crops the resulting energy loads on the project. The assumed photoperiod for the calculations is 18 hours.
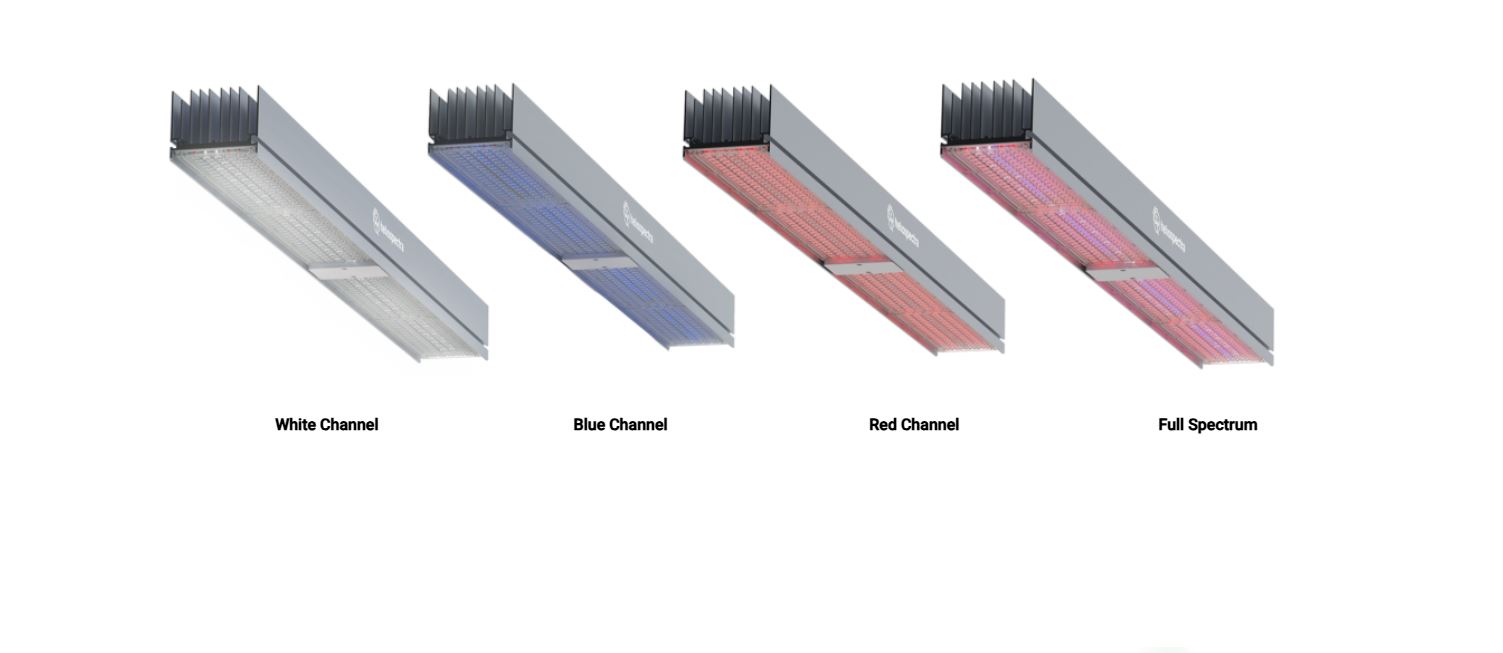
5.1 Baseline Design
The lights should provide optimal lighting conditions without disturbing the optimal climatic conditions of the plant; a rise in temperature near the plant canopy due to heat from the lighting system needs to be avoided. The light selected as a model for these features is the Heliospectra LightBar V101G-L . It is optimized for water cooling and specifically developed for VF applications. It produces a light spectrum specially designed to optimize photosynthesis. Its dimensions are 1235 x 56 x 62 mm and its power consumption is ap proximately 125 W at normal operation, an initially more expensive but operationally cheaper approach would be the DYNA C9 model or MITRA X Flex which is more than twice as efficient, thus fewer units would be needed.
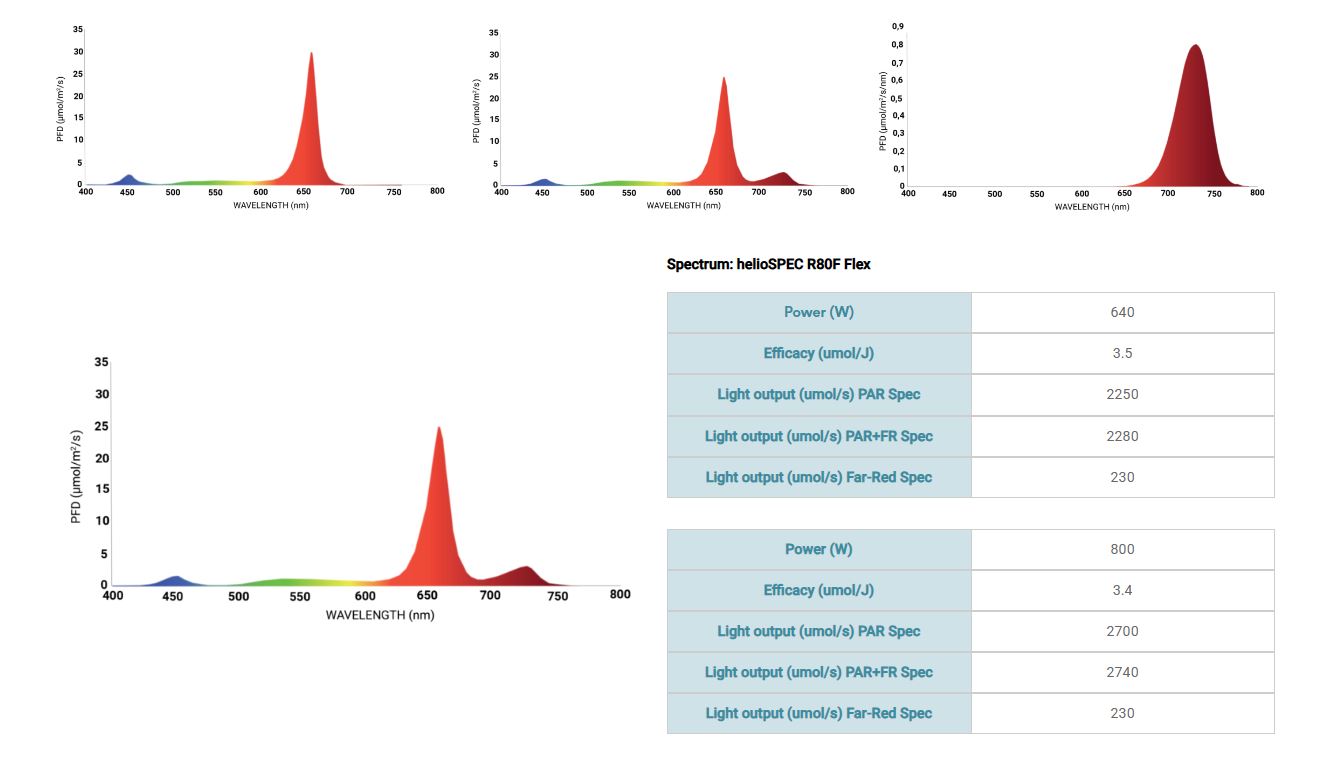
The lamps should be placed at 0.25 m from the top of the plant canopy. For the
first section of the growth level, where the plants are in the early development
stage (day 0-10), the lighting system should provide 200 μmol / m² s of
Photosynthetically Active Radiation (PAR), defined as light available for
photosynthesis between the wavelengths of 400-700 nm, and 30 μmol / m² s of Far
Infrared Radiation (FIR). Throughout the middle section of the growth levels,
where the plants are in the second phase of development , the lighting system
should provide 225 μmol / m²s PAR and 34 μmol / m² s FIR.
For the final section of the growth levels, where the plants reach maturity (day
19-28), the lighting system should provide 250 μmol / m² s PAR
only. The lighting system layout is designed with sets of four light bars when
using V101G-L, which are mounted end to end, perpendicular to the length of the
growth rack Each level of the growth rack contains 70 sets of lights, thus there
is a set of lights every 0.71 m. Each set is powered by an Artesyn LCC 600 watt
conduction cooled AC-DC power supply.
Each light set is supplied with 500 W to power the lights, which adds to 35000 W per level in each growth rack. Each growth rack has five grow levels with lights; the total power demand for each cultivation rack is 175 kW. The total power needed for the whole cultivation area is 880 kW. Ap proximately 40% of the heat is dissipated by the liquid cooling (352 kW), the rest is radiated to the surrounding air (528 kW). The nurseries use a separate lighting system which provides 150 μmol / m² s PAR, with a power consumption of 37.5 kW. This brings the total power consumption for the production module to 917.5 kW.
6 Air Management & Thermal Control System
As mentioned above the cultivation area air will have two major sources of thermal energy: sensible energy from the LED lighting system and latent energy from transpiration of the crops. The air management and thermal control systems primary goal is to remove this extra energy to maintain optimal growing conditions. Warm and moist air from the plant compartment is transported to the air management and thermal control system room, located in the core of the module, where it is mixed with CO2 to obtain optimal CO2 levels. This air is then moved to the first stage of the heat pump where it is cooled, allowing it to decrease its humidity content by means of condensation. This re claimed water is transported to buffer tanks, filtered through a UV filter, and used later by the nutrient delivery system. The cooled air (with high relative humidity) then passes to the second stage of the heat pump where it is heated again to deliver air that will provide the target conditions inside the growth compartment. Extra heat will dissipate through heat exchanger units mounted on the side wall of the core structure in each module. The design of the system is based on the capacity to dehumidify the warm moist air coming from the cultivation areas to maintain optimal conditions. The ventilation rate needed to remove the extra humidity content from the growth compartment air can be calculated using the following equation:
\[\dot{V} = \frac{E}{x_{\text{in}} - x_{\text{out}}} \times \frac{1}{\rho}\]where $\dot{V} $ is the required ventilation rate in m³/m²/h,E is the evapotranspiration rate of the crop in g/m²/h, is the absolute air humidity inside the compartment in g/kg, $ x_{\text{out}} $ is the absolute air humidity of the air at the outlet of the air management system in g/kg and $ \rho $ is the density of the air in kg/m³. It is assumed that 100 % of the water vapor in the treated air is recovered. The total energy removed from the ventilated air is obtained from the following equation:
\[E_{\text{remove}} = \frac{\dot{V} \times \rho}{3600} \times \left( \left( h_{\text{in}} - h_{\text{out}} \right) + \left( H \times \left( x_{\text{in}} - x_{\text{out}} \right) \right) \right)\]Where $ E_{\text{remove}} $ is the energy removed in kW/m², H is the evaporation heat of water at 0°C in kJ/kg, $ h_{\text{in}} $ is the enthalpy inside the compartment in kJ/kg, and $ h_{\text{out}} $ is the enthalpy of the air from the outlet of the air management system in kJ/kg.
The desired conditions inside the lettuce production area are 23°C and 80 % relative humidity (RH) (Jasper den Besten, HAS university). It is assumed that most of the evapotranspiration of the plants occurs during lighting hours, the photoperiod for this crop is 18 hours of light per day. Evapotranspiration of the crop was only considered for the photoperiod of 18 h (Jasper den Besten, HAS university). Using a maximum evapotranspiration value of 3 l/m² per day (18 h), it results in 167 g/m² per hour of water vaper added to the air by the plants.
In order to achieve a de-humidification of 167 g/m² per hour and assuming the air management sys tem provides cooling conditions of 10°C and 100 % relative humidity, a ventilation rate of 21.9 m³/h is needed for each square meter of cultivation surface. The latent energy removed at this stage is 0.116 kW per square meter of cultivation space and the removed sensible heat is 0.210 kW/m², which results in a total energy removal of 0,326 kW/m². The total recirculation ventilation rate of a single 5.000 m² lettuce module cultivation area is 109.686 m³/h. It is assumed that the module needs 8 refreshments of outdoor air per day, which adds 3.500 m³/h. This addition of environmental air will add to the final amount of CO2 which needs to be added to the growth compartment. The CO2 requirements were calculating assuming an average assimilation rate of the crop inside the leafy greens module of 4 g/m² h and in the high wire cultivation module of 5 g/m². External CO2 concentration was assume constant at 400 ppm.
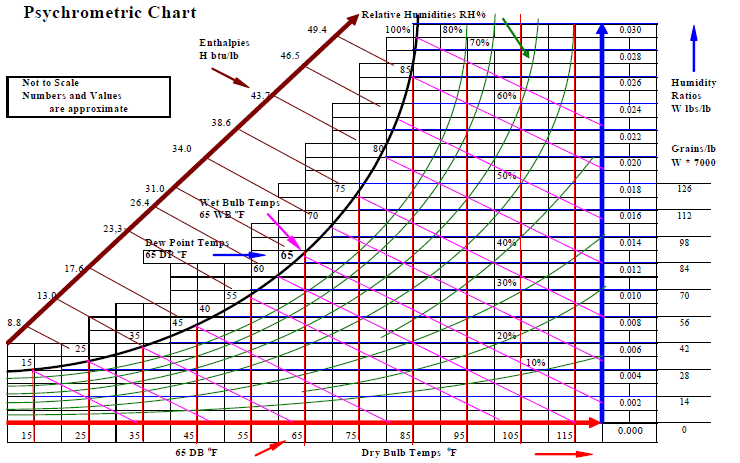
It is assumed that the air is reheated to 21°C before reintroducing it to the plant compartment. The temperature at the outlet of the ventilation ducts is 21°C and the absolute humidity of 7.6 gH2O/kgair, which results in a relative humidity of 49.5%. The air management process represented in the psychrometric chart of the closed loop. A total of 0.084 kW/m² is needed to reheat the air to 21°C. The total recovered heat from the pro cess is 0.242 kW/m². Power consumption for this processes are estimated in hot and cold cases. In the hot case, the energy consumption for the HVAC system is 400 kWh per year, with a peak day of 1.85 kWh with a coefficient of performance (COP) of 2.6. In the cold case, the energy consumption for the HVAC system is 160 kWh per year, with a peak day of 1.10 kWh with a COP of 4.5.
The supply of air to each layer of the cultivation rack is done using a 500 mm round duct, this duct keeps allowable air speeds below 8 m/s. 90°angles should not be used in the pipe to avoid pressure loss. Distribution of air inside the levels of the racks is achieved using 5 channels of 500 mm x 200 mm which results in air speeds of approximately 0.3 m/s. The logical layout is one channel for every meter of layer width
7 Plant Health Monitoring & Control Architecture
Controlling and monitoring the climate and status of the plants are essential elements in any agricultural production. It allows taking corrective measures in time to avoid a decrease in yield and a potential loss of marketable product. The automatic control of climate variables enables optimum conditions inside the cultivation modules, helps to reduce energy consumption and delivers the best product possible. In this section, monitoring and control elements are addressed.
To create a healthy growing environment, temperature, relative humidity (RH) and CO2 have to be carefully controlled. For optimum control, a climate controller located in the core of each module is installed to measure temperature, RH and CO2 sensors. Environmental conditions are constantly monitored and are electronically maintained. The amount of fresh air allowed into the building along with the recycled air is carefully controlled to keep the conditions stable and optimal.
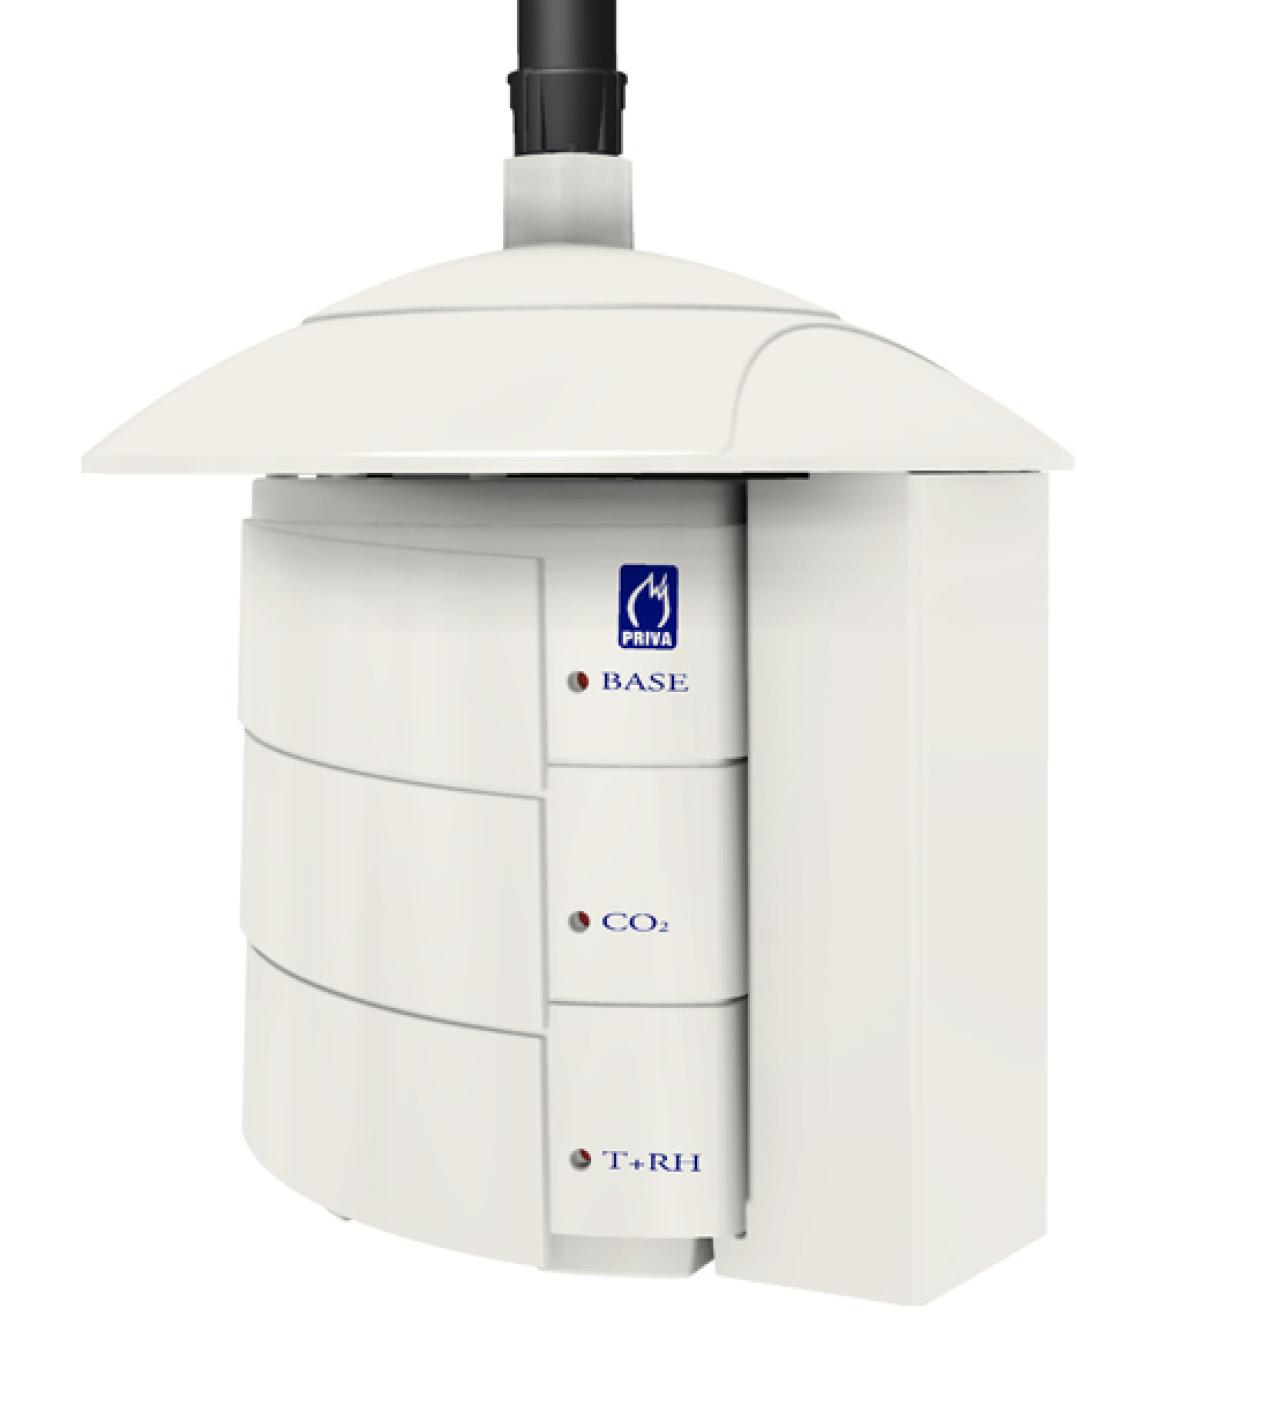
The climate controller receives constant measurements from several Priva E-Measuring boxes, or
similar sensor (Raspberry pi with modules), located in each cultivation area. The box contains sensors for
temperature, RH and CO2. Nurseries are also equipped with these sensor boxes for climate monitoring.
6 boxes are distributed in the cultivation area.
The climate controller responds to these sensors to keep the optimal climactic conditions
inside each cultivation module.
Clean conditions inside the production modules are maintained through the use of an airlock decontamination system to ensure the growing environment remains clear of any plant pathogens or fun gal and bacterial infections. In the airlock chamber, workers disinfect their hands using soap and water as well as put on sterile over suits with hairnets and shoe covers. In case of a contamination event, the responsible contaminant/pathogen will be identified and treated with hand held pump sprayers. To prevent insect and fly infestations, in case they are brought into the clean growth area, 50 Sticky cards are equally distributed inside the cultivation modules. Regular inspections by the head grower of the facility will help to identify any negative factors quickly and timely decisions can be made with regards to the required solution.