Pilot Study - Budget Report
Name: Issa Fares Date: 2024-19-01 Contact: faresissa22@gmail.com
1. Introduction
This report outlines the budget for the pilot study of a vertical farm project. The project involves the construction of a vertical farming facility from the ground up, incorporating advanced systems for nutrient delivery, environmental control, and lighting. The goal of this pilot study is to validate the feasibility and efficiency of the proposed design.
2. Budget Overview
The budget is divided into the following main sections:
- I. Building Structure
- II. Nutrient Delivery System
- III. Gutter Framework
- IV. HVAC System
- V. Specialized Lighting System
- VI. Overheads
- VII. Nutrient solution compounds
Each section includes estimated costs, descriptions of components, and justifications for the expense.
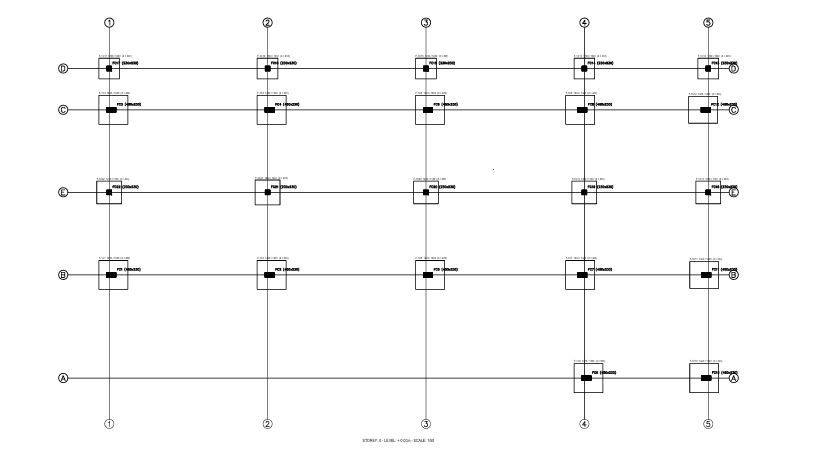
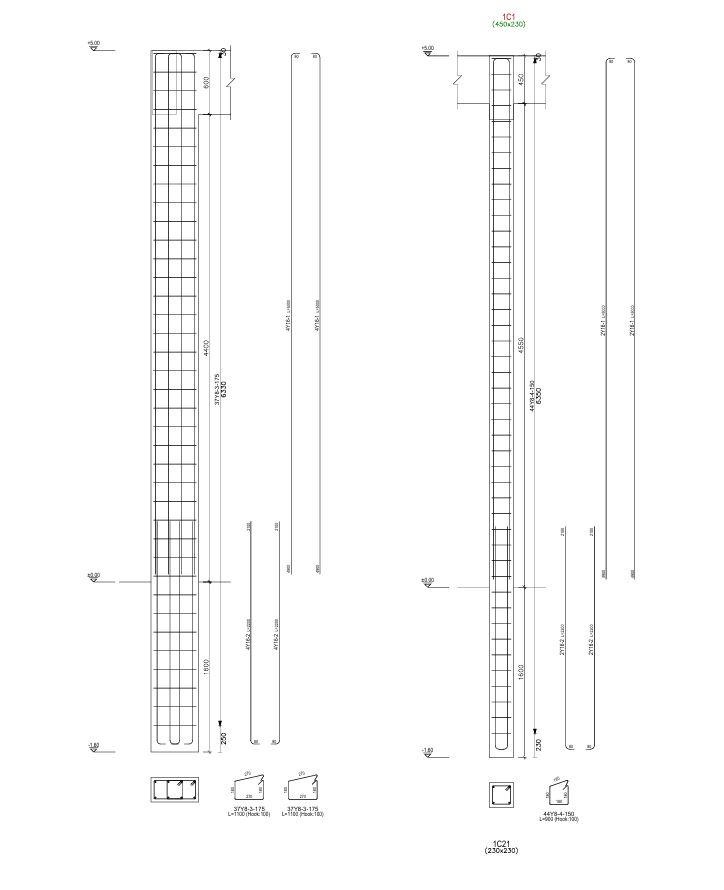
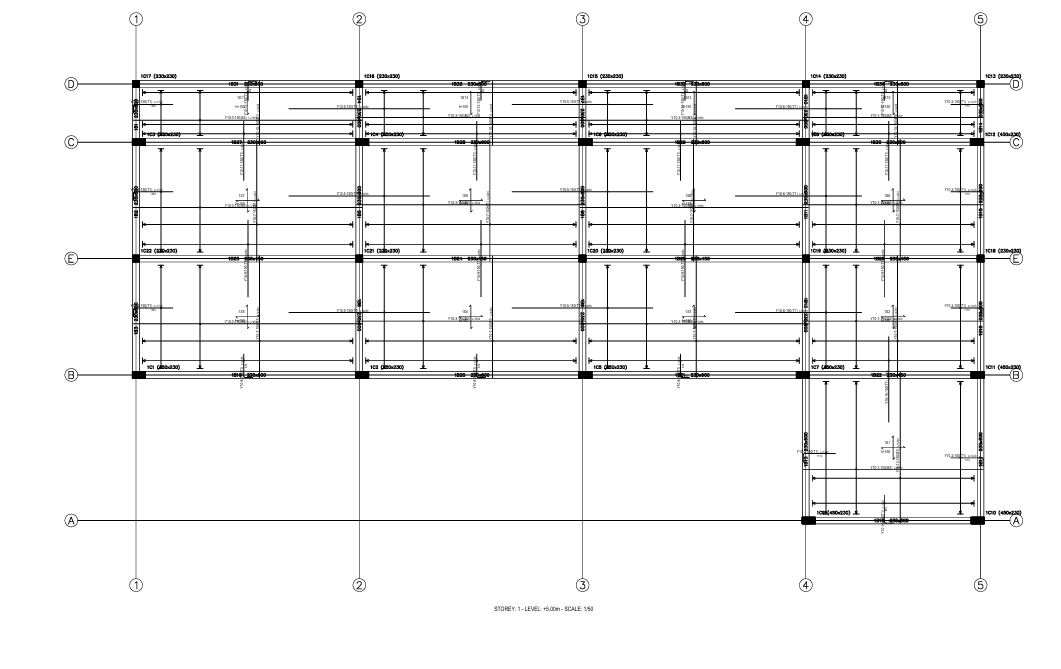
3.0 Building Structure
Description
The building structure will be constructed from the ground up, designed to accommodate vertical farming systems. It will include reinforced foundations, walls, and roofing to support the weight of the farming infrastructure and ensure durability.
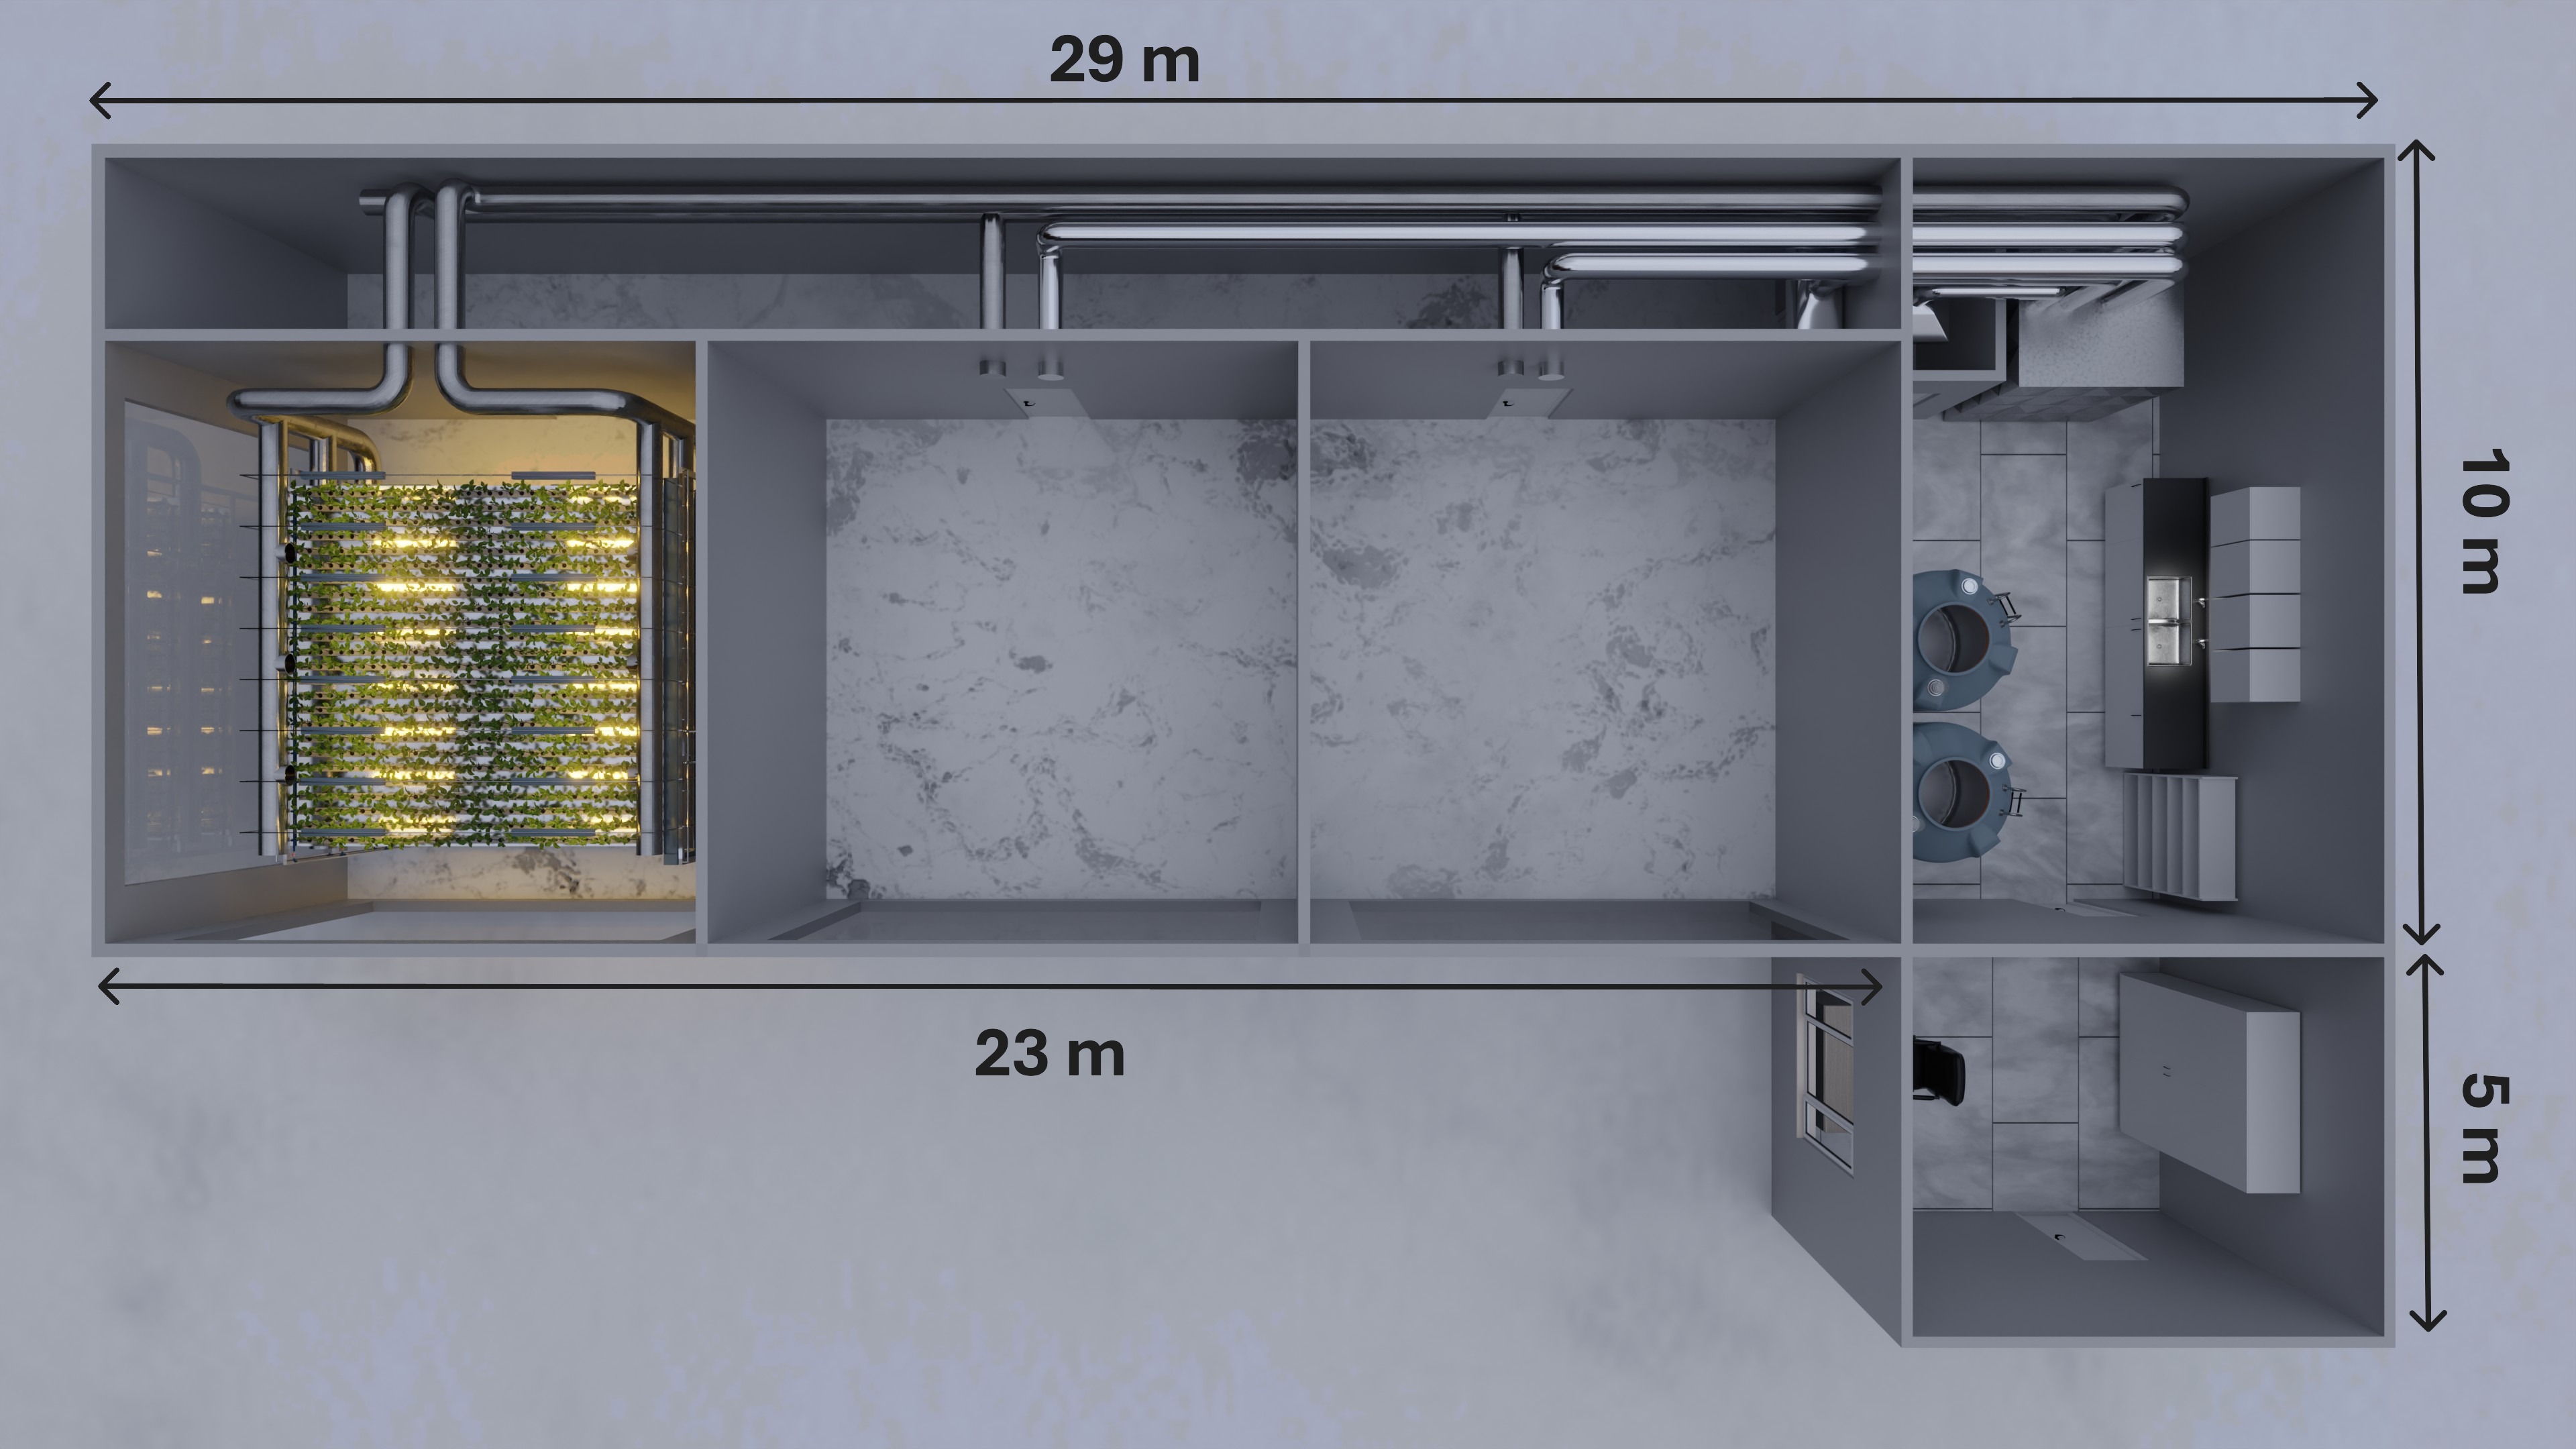
3.1 Site layout
3.2 Cost Breakdown
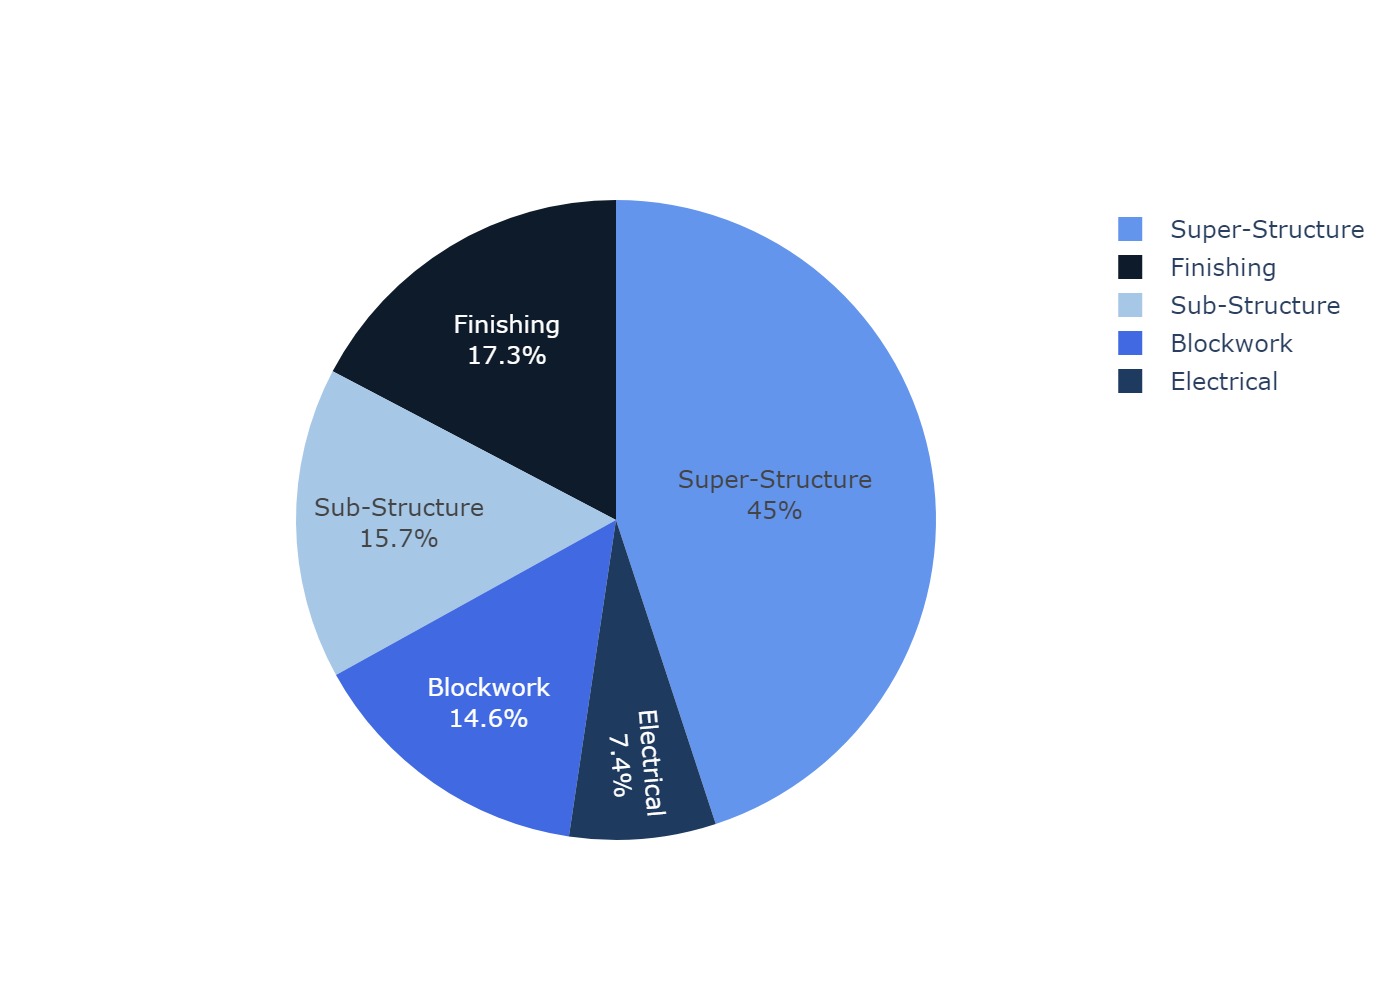
| Sub-Structure (₦9,897,800) | Super-Structure (₦28,281,000) | Blockwork (₦9,188,500) | Electrical (₦4,652,500) | Finishing (₦10,889,500) |
|---|---|---|---|---|
| Site Clearing | Formwork to Columns and Beams | Block to Headcourse | Electrical Piping and Wiring | Plastering of Walls Both Faces |
| Excavation of Foundation | Casting to Columns and Beams | Fixtures and Fittings | Dressing of Doors and Windows | |
| Starter: Columns and Base | Formwork to Headcourse | Epoxy Flooring | ||
| Casting of Foundation | Rebar to Headcourse | Site Clearing to Handover | ||
| Blockwork Filled Solid | Rebar to Column and Beams | |||
| Casting of Starter Column | Casting of Headcourse | |||
| Hardcore Filling and Compaction | Formwork to Suspended Roof | |||
| Damp Proof Course (DPC) | Rebar to Suspended Roof | |||
| Casting of Suspended Roof |
| Description | Unit | Qty | Unit Price (₦) | Total (₦) | |
|---|---|---|---|---|---|
| Reinforcement | Y16 for Columns | Units | 67 | 22,700 | 1,520,900 |
| Y16 for Beams | Units | 310 | 22,700 | 7,037,000 | |
| Y10 for Stirmp | Units | 50 | 8,700 | 435,000 | |
| Blocks | Units | 12,522 | 700 | 8,765,400 | |
| Reinforcements | Y12 for Slab | Units | 420 | 12,300 | 5,166,000 |
| Cement | Blockwork | Bags | 140 | 9,500 | 1,330,000 |
| Casting of Columns | Bags | 64 | 9,500 | 608,000 | |
| Casting of Slab | Bags | 350 | 9,500 | 3,325,000 | |
| Casting of Beams | Bags | 150 | 9,500 | 1,425,000 | |
| Casting of DPC | Bags | 360 | 9,500 | 3,420,000 | |
| Casting of Binding | Bags | 150 | 9,500 | 1,425,000 | |
| Casting of Plaster | Bags | 200 | 9,500 | 1,900,000 | |
| External Plaster | Bags | 200 | 9,500 | 1,900,000 | |
| Marine Boards | Units | 490 | 26,500 | 12,985,000 | |
| Bamboo | Units | 300 | 2,300 | 690,000 | |
| Braces | 2x3 | Units | 500 | 200 | 100,000 |
| 2x4 | Units | 500 | 200 | 100,000 | |
| Nails | 3 Inch | Bags | 9 | 33,000 | 297,000 |
| 6 Inch | Bags | 6 | 35,000 | 210,000 | |
| Sand | Plaster Sand | Trips | 14 | 130,000 | 1,820,000 |
| Sharp Sand | Trips | 14 | 140,000 | 1,960,000 | |
| Gravel | Size 3/4 | Trips | 8 | 430,000 | 3,440,000 |
| Laterite | Trips | 15 | 70,000 | 1,050,000 | |
| Total | 60,909,300 | ||||
| Location | Item | Qty | Unit Price (₦) | Amount (₦) |
|---|---|---|---|---|
| Office | Office Chair | 3 | 65,000 | 195,000 |
| Office Table | 2 | 120,000 | 240,000 | |
| Cabinet | 1 | 150,000 | 150,000 | |
| Seating Area | 1 | 150,000 | 150,000 | |
| Computer | 2 | 400,000 | 800,000 | |
| Lab | Chemical Equipments | 1 | 500,000 | 500,000 |
| Laboratory Workstation | 1 | 850,000 | 850,000 | |
| Reusable Coverall | 10 | 18,000 | 180,000 | |
| Long Sleeve Latex Gloves | 20 | 2,000 | 40,000 | |
| Disposable Face Masks | 400 | 70 | 28,000 | |
| Steel Seal Doors | 4 | 500,000 | 2,000,000 | |
| Seco-Larm Enforcer Electromagnetic Lock with LED, Bond & Door Position Sensor | 2 | 320,000 | 640,000 | |
| Emergency Glass enclosed Exit Button | 3 | 16,000 | 48,000 | |
| Misc | - | - | 200,000 | |
| Total | 6,021,000 | |||
4.0 Vertical Farm Nutrient Delivery System
Description
The Nutrient Delivery System (NDS) is a critical component of the vertical farm. It includes stainless steel tanks, piping, controllers, sensors, and actuators. The system will be integrated with a SCADA (Supervisory Control and Data Acquisition) system using VTScada for real-time monitoring and control.
4.1 System Overview
The nutrient delivery system is designed to automate the preparation, storage, and distribution of nutrient solutions for a three-level vertical farm. The system ensures precise control of nutrient composition and delivery timing, optimizing plant growth and resource efficiency. It consists of two primary tanks:
- Tank A (Mixing Tank): Prepares the nutrient solution by filtering, adjusting electrical conductivity (EC), and pH levels.
- Tank B (Reservoir Tank): Stores the prepared solution and delivers it to the vertical farm during scheduled feeding cycles.
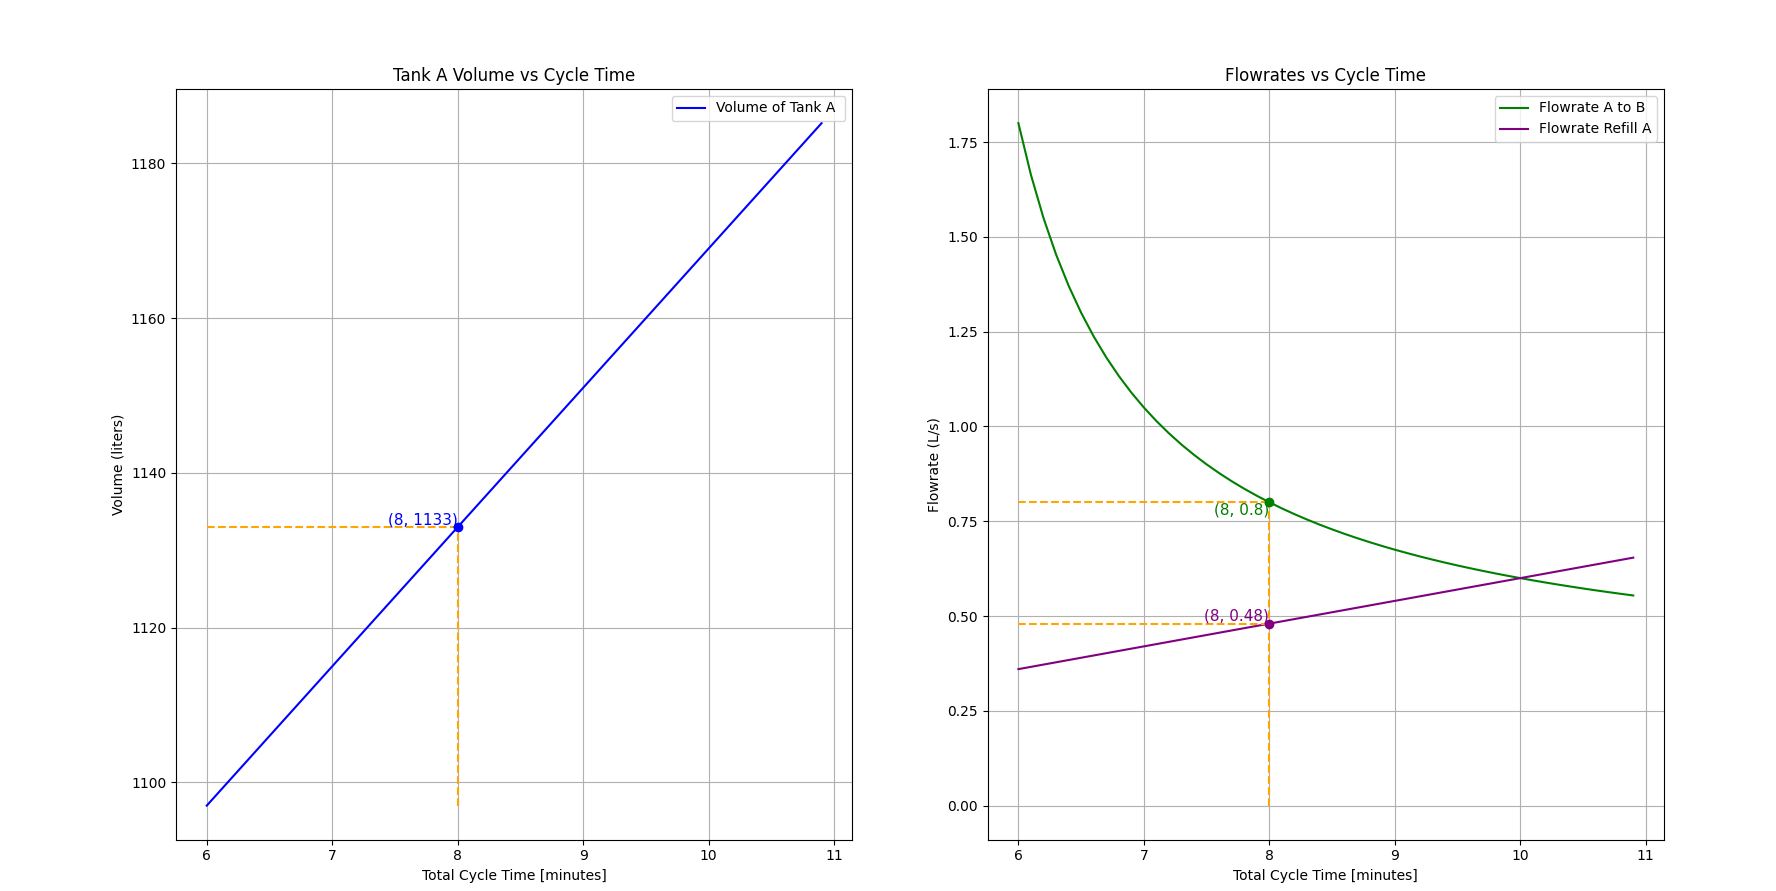
The system operates on a 8-minute cycle, divided into two phases:
- Mixing Phase (5 minutes): Tank A prepares the nutrient solution by filtering used water, adding fertilizers based on EC readings, and adjusting pH using acid or base solutions.
- Pumping Phase (3 minutes): The prepared solution is pumped from Tank A to Tank B at a flow rate of 0.8 L/s.
During this process, Tank B continuously pumps the solution to the vertical farm unit. Each level of the farm receives nutrient solution for 5 minutes, followed by a 10-minute rest period, controlled by solenoid valves to ensure only one level is fed at a time.
4.2 Key Design Considerations
4.2.1 Nutrient Solution Preparation
- EC Measurement: Fertilizer is added to the solution based on real-time EC readings to maintain optimal nutrient concentration.
- pH Adjustment: Acid or base solutions are dosed to achieve the desired pH level, ensuring nutrient availability and plant health.
- Water Source: Used water from the previous cycle is filtered and reused. If insufficient, reverse osmosis (RO) water is added to achieve the required volume.
4.2.2 Cycle Timing and Efficiency
- The 10-minute cycle (5 minutes mixing + 5 minutes pumping) was determined to be the most appropriate when the mixing time was set to 5 minutes based on flow rate and tank volume calculations, but to give leeway to for correction incase of operational errors, the 8 minute cycle (5 minutes mixing + 3 minutes pumping) was selected.
- Figure 6 illustrate the relationship between flow rate, tank volume, and cycle timing, confirming the optimal cycle duration.
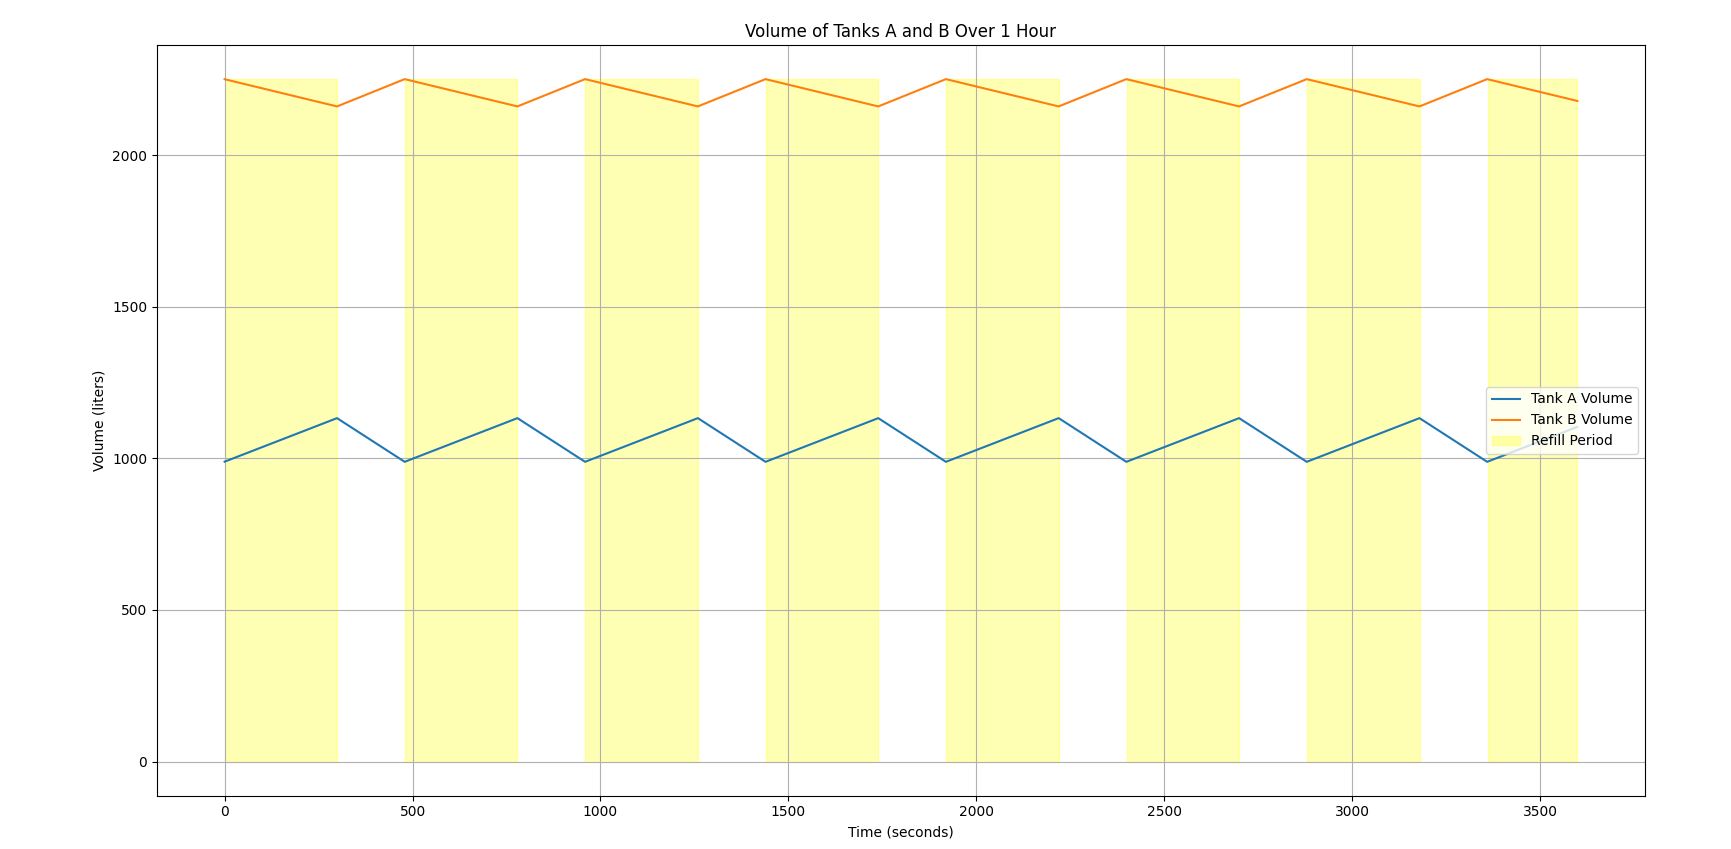
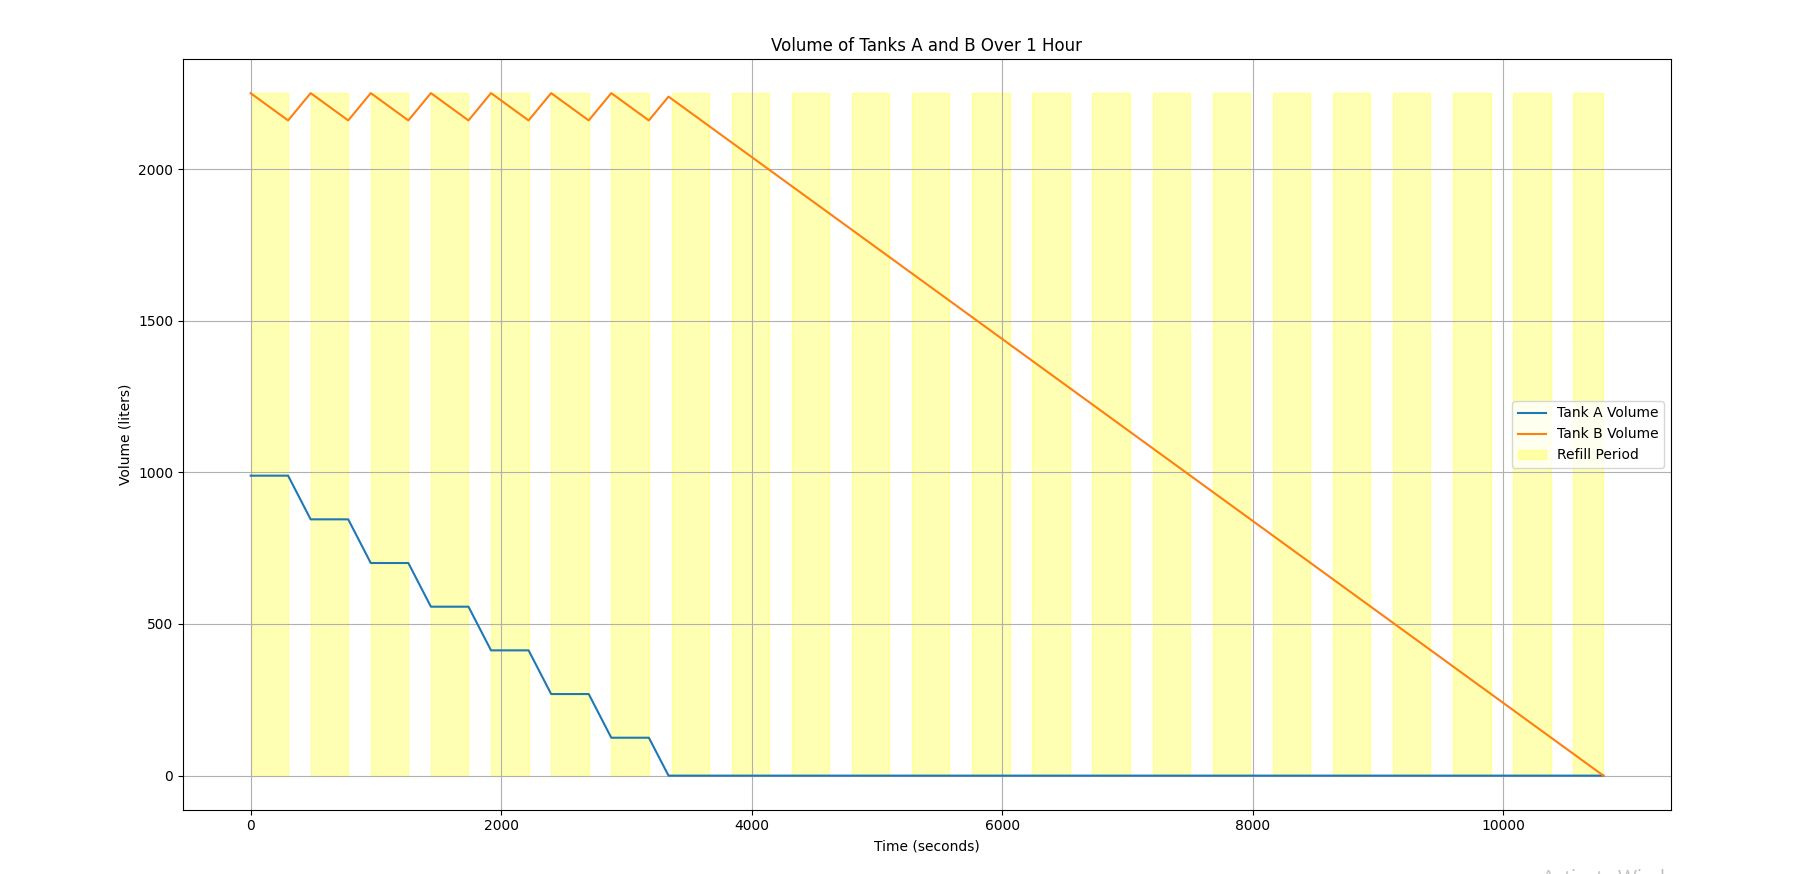
- once the mixing time was set, and the cycle time was found, the tanks sizes A and B wre interpolated and used to draw the tank accordingly. Figure 7 bellow shows the expected cycle for further clarification.
4.2.3 Tank Sizing and Engineering
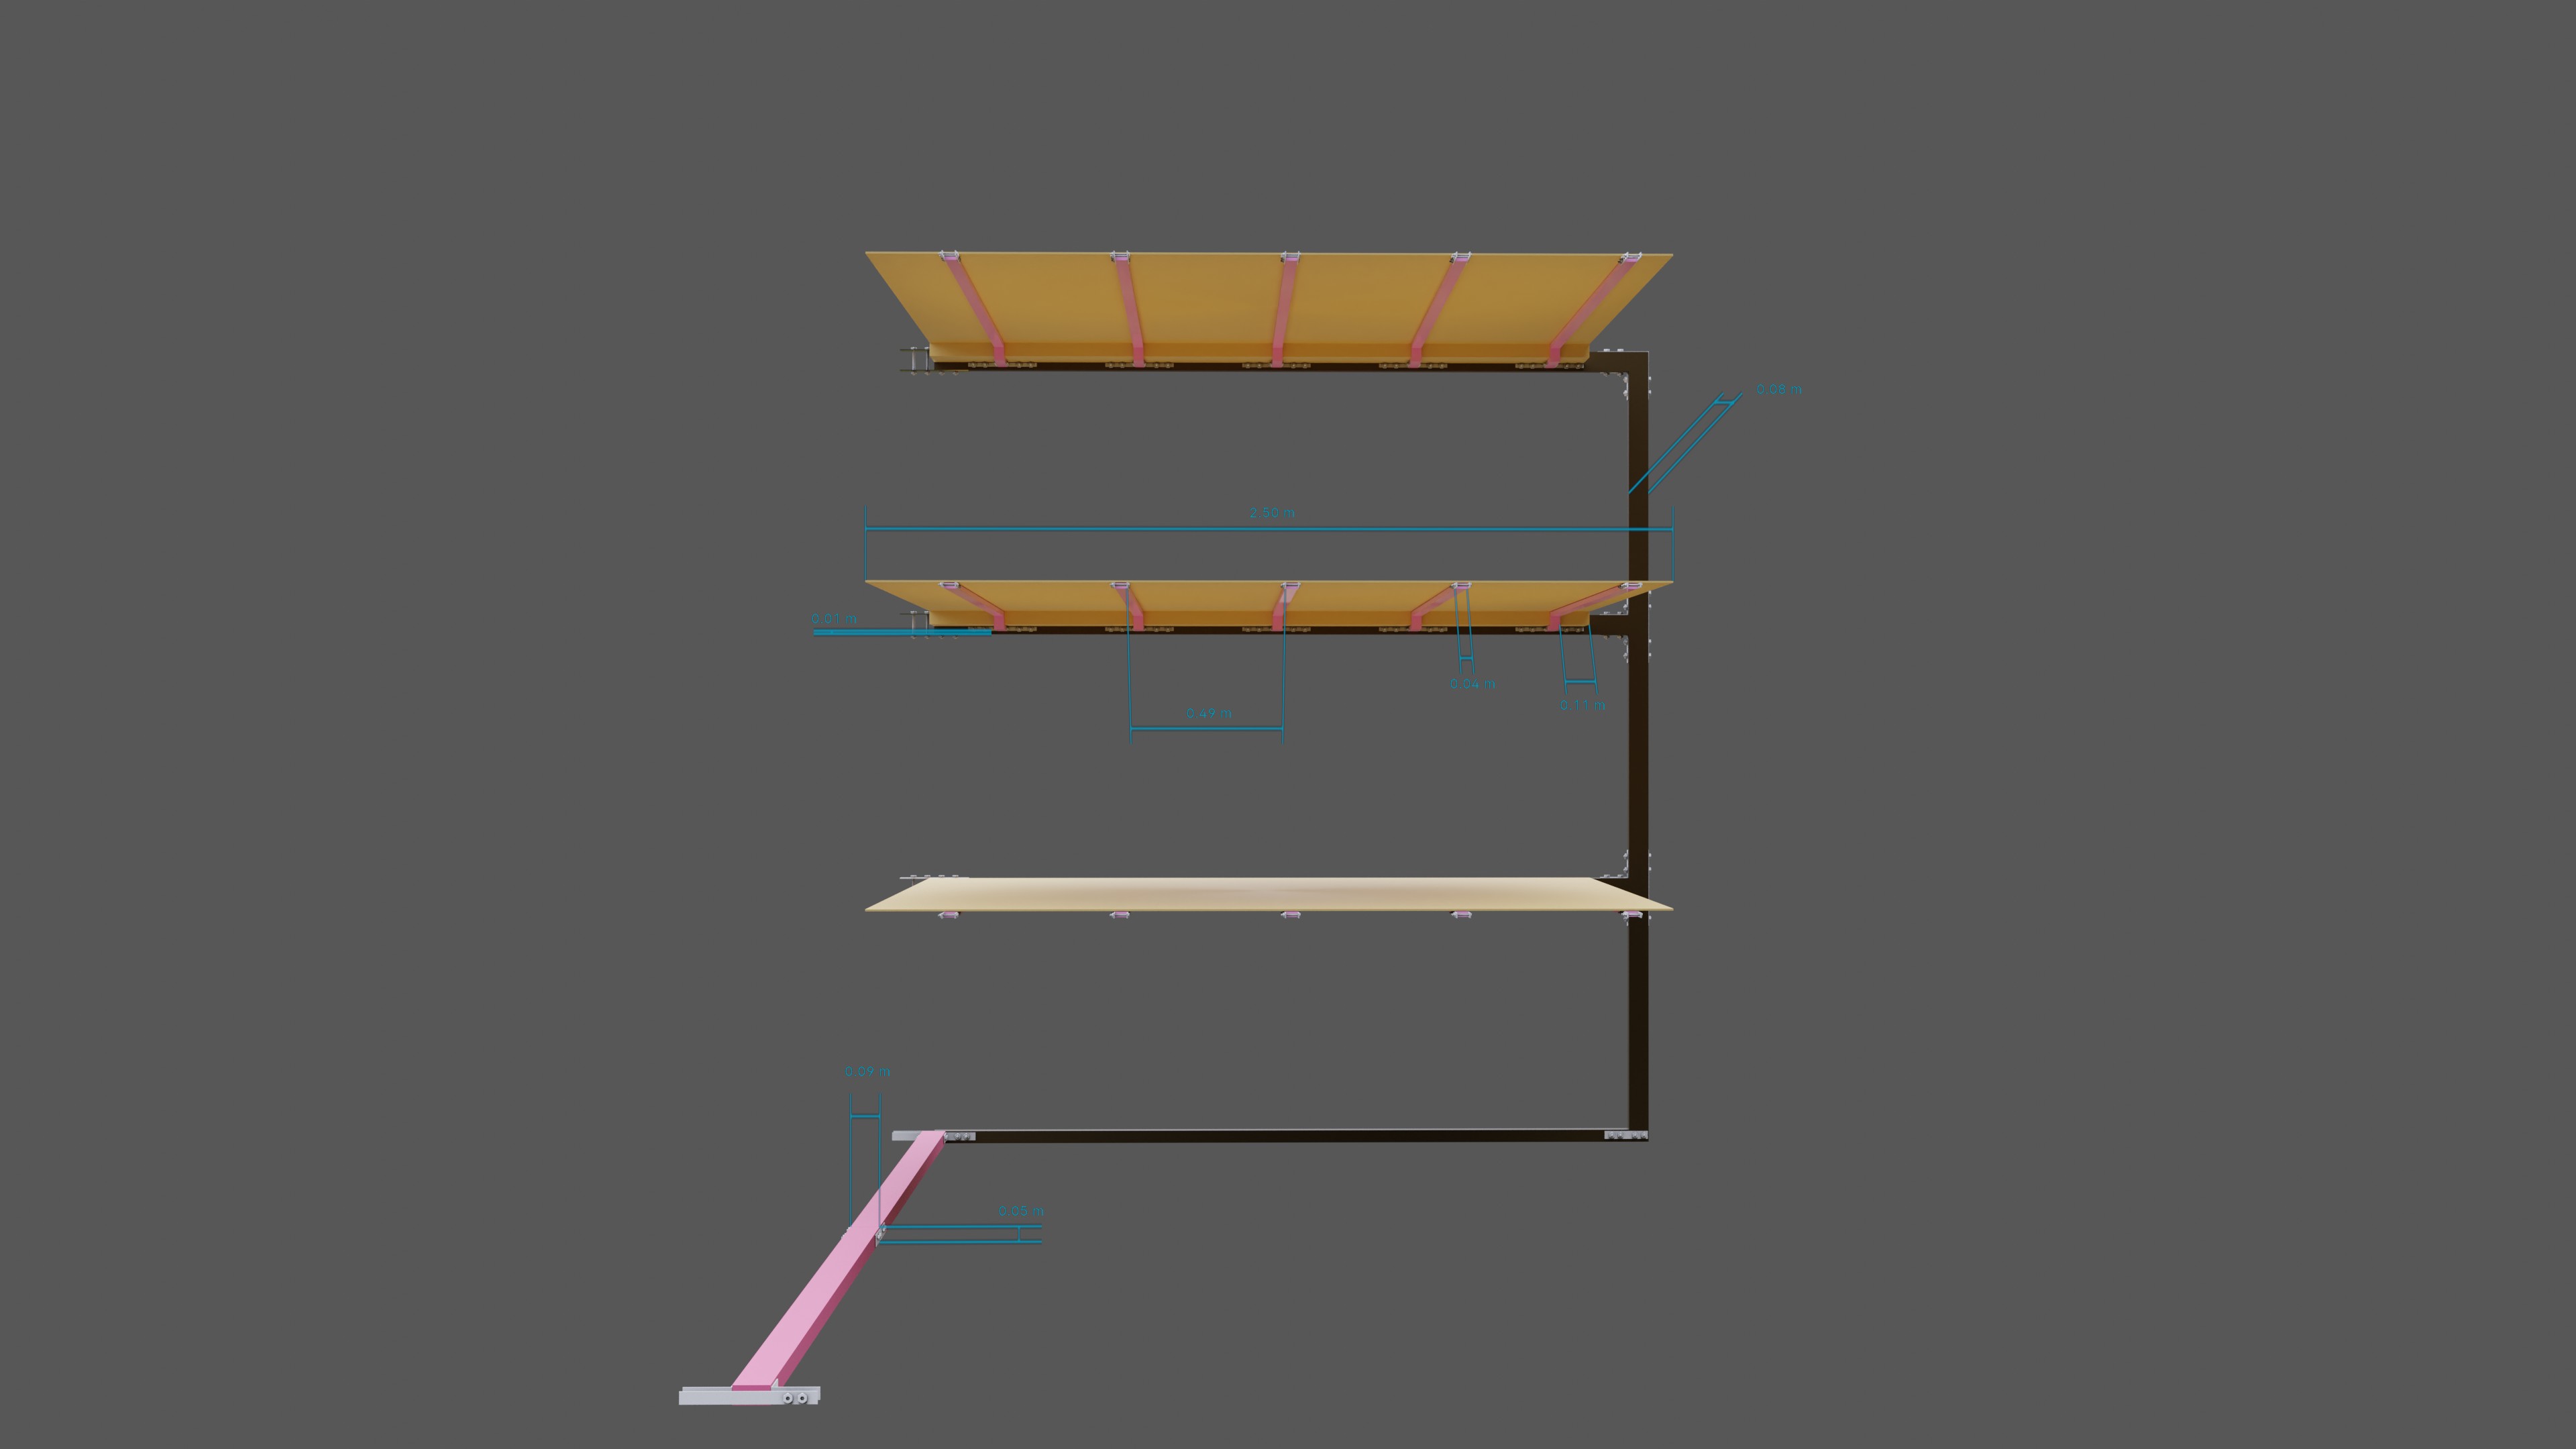
- Using the volumes of Tank A and Tank B that were determined earlier, and with the help of engineering principles guidelines for mixing tanks, the dimensions of the tanks were drawn to scale, shown in Figure 9 below. Examples of the principles used are:
- The height-to-diameter ratio of 1-1.5 for efficient axial reach.
- The position, number, and type of blade (in our case, a hydrofoil) for a low-viscosity, non-solid suspended fluid.
- Lining of the tank with flaps to prevent vortex formation at a protrusion depth of 0.1-0.12 times the diameter of the tank.
- A bottom dome to prevent stagnation areas.
- Height redundancy to prevent spillage and a buffer allowance at the flaps to encourage laminar flow at the surface of the solution.
Figure 9: Tanks A and B final render 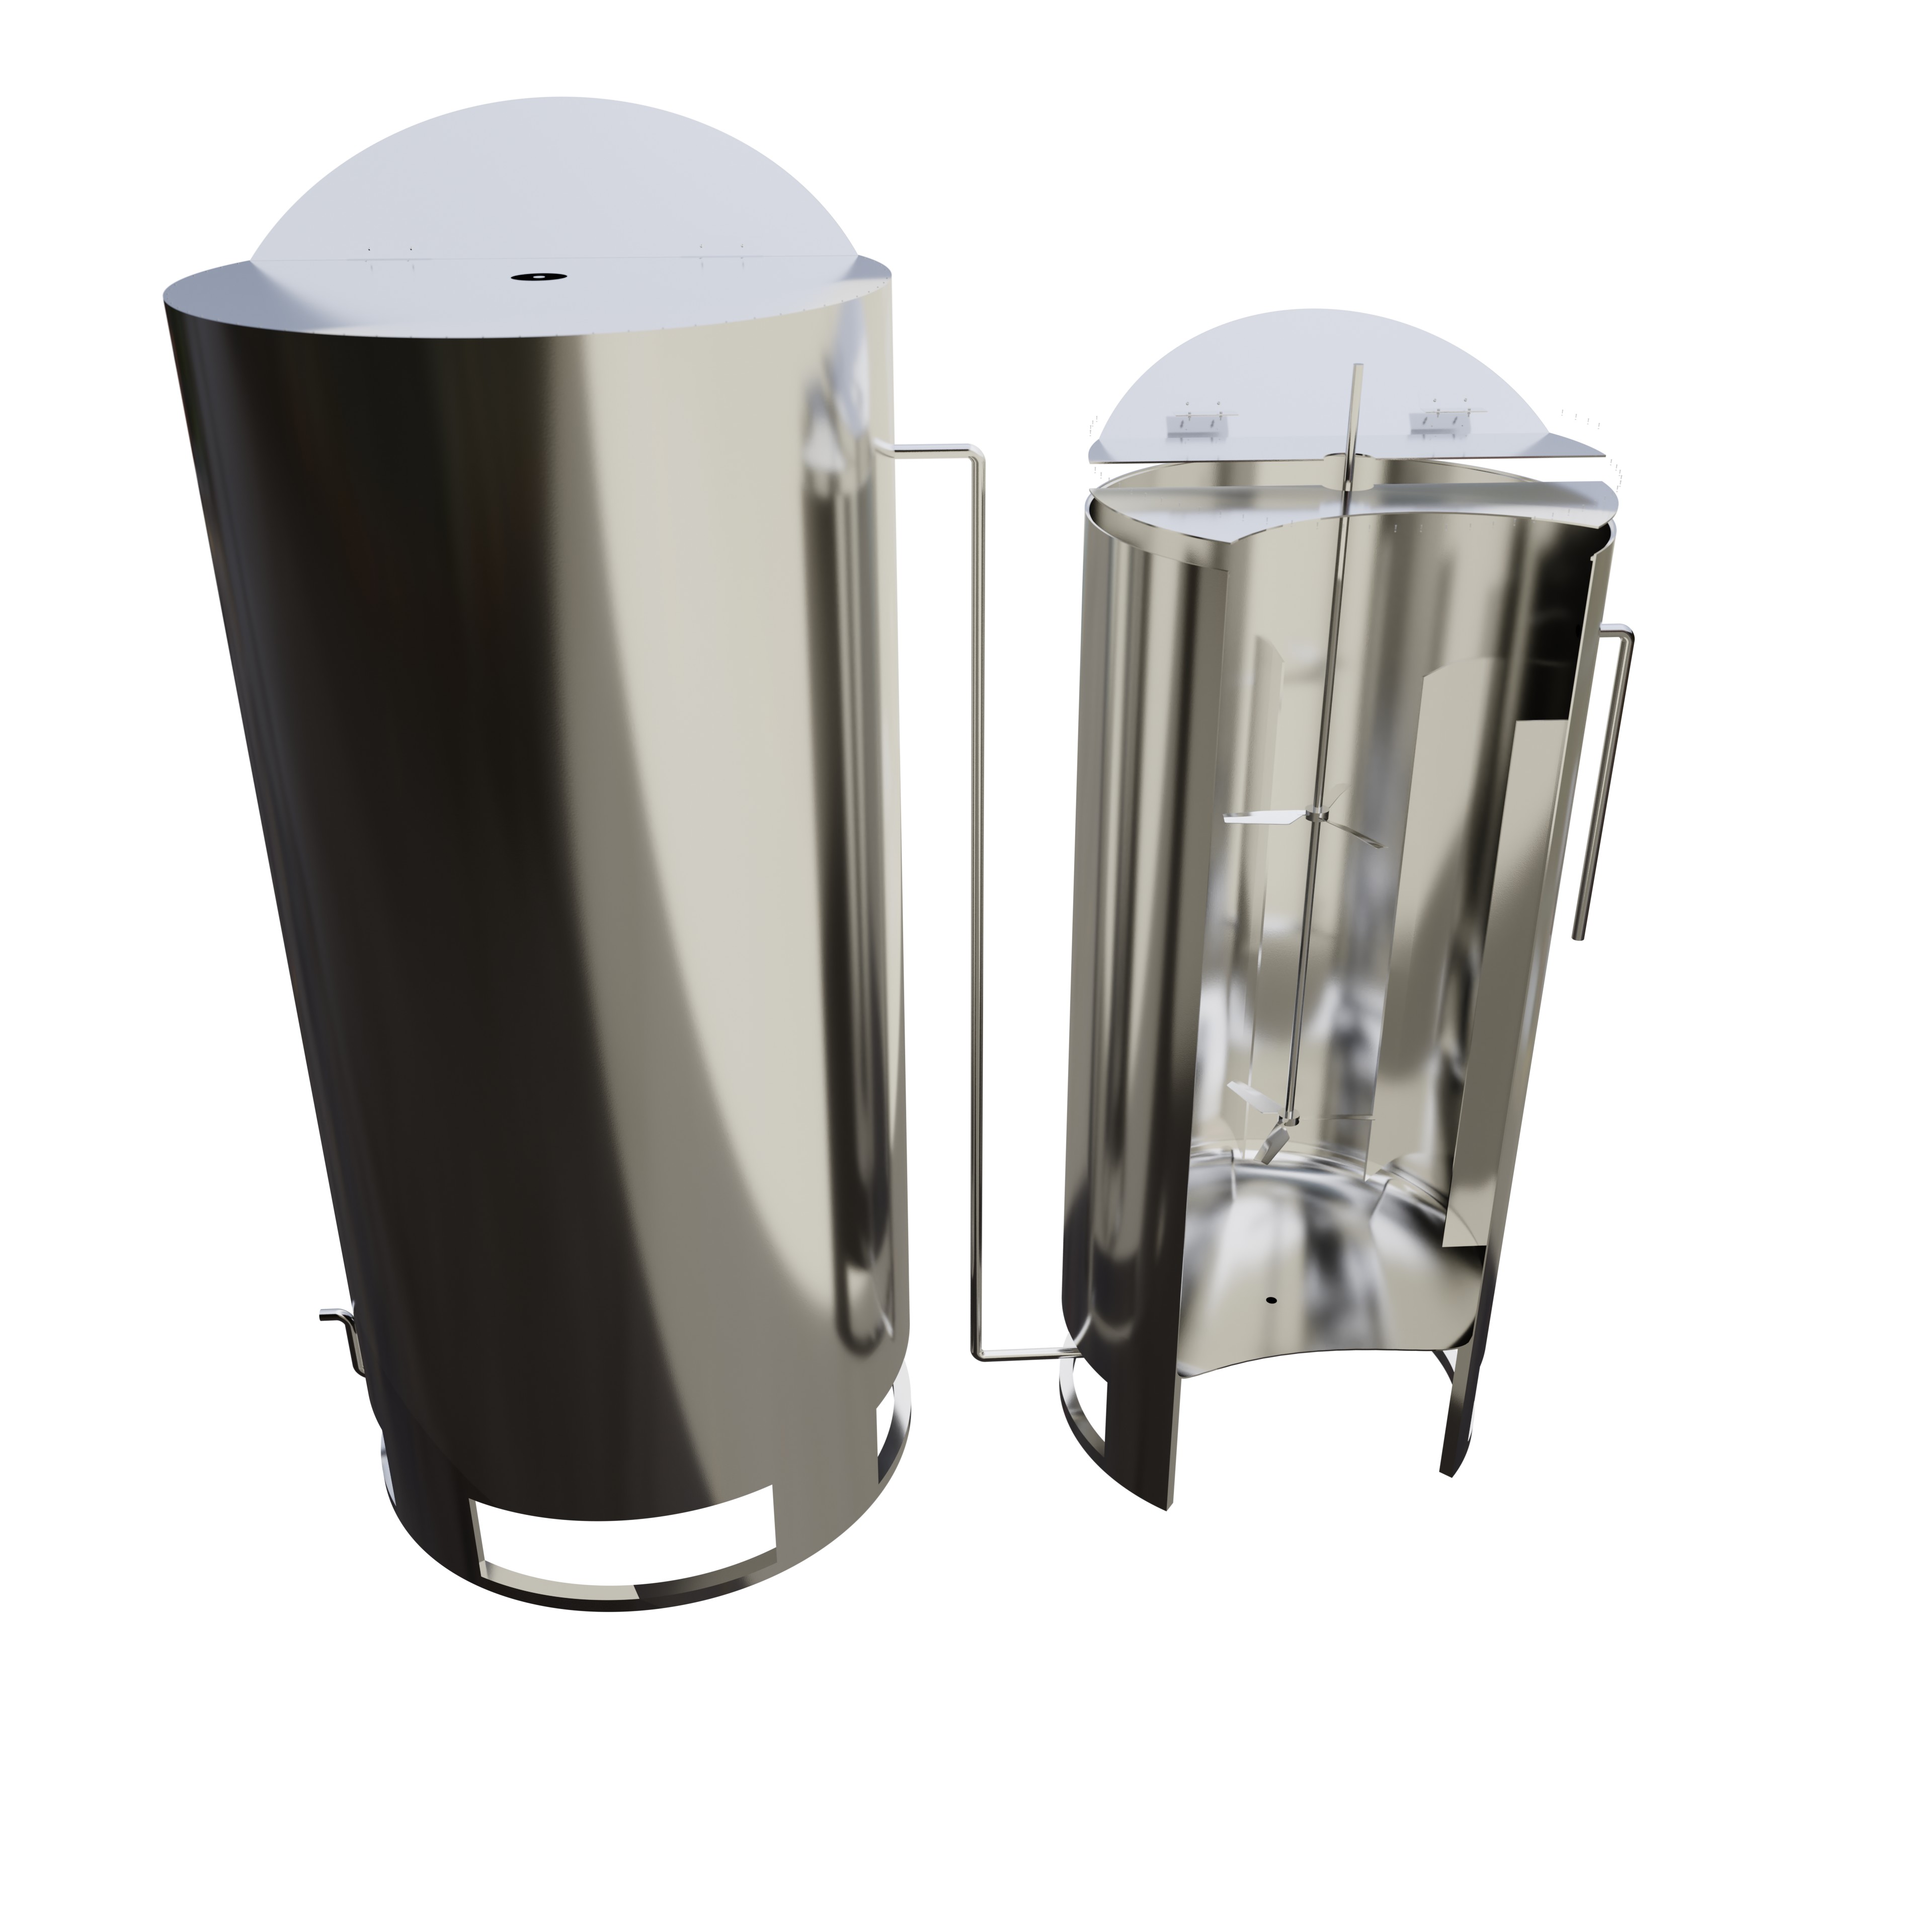
- Tank heights were measured to account for head pressure loss due to elevation, which influences pump selection, pipe selection and system performance that will be reviewed next.
4.2.4 Pipe Sizing and Pressure Loss
To ensure efficient flow rates and minimal energy consumption, a comprehensive analysis was conducted to account for pressure losses arising from pipe length, friction, joints, and elevation changes. These factors were derived from the design layout established during the construction phase. Additionally, the dimensions of the tanks, as designed in earlier stages, and the material properties selected for the system were carefully incorporated into the analysis to guarantee reliable and accurate results.
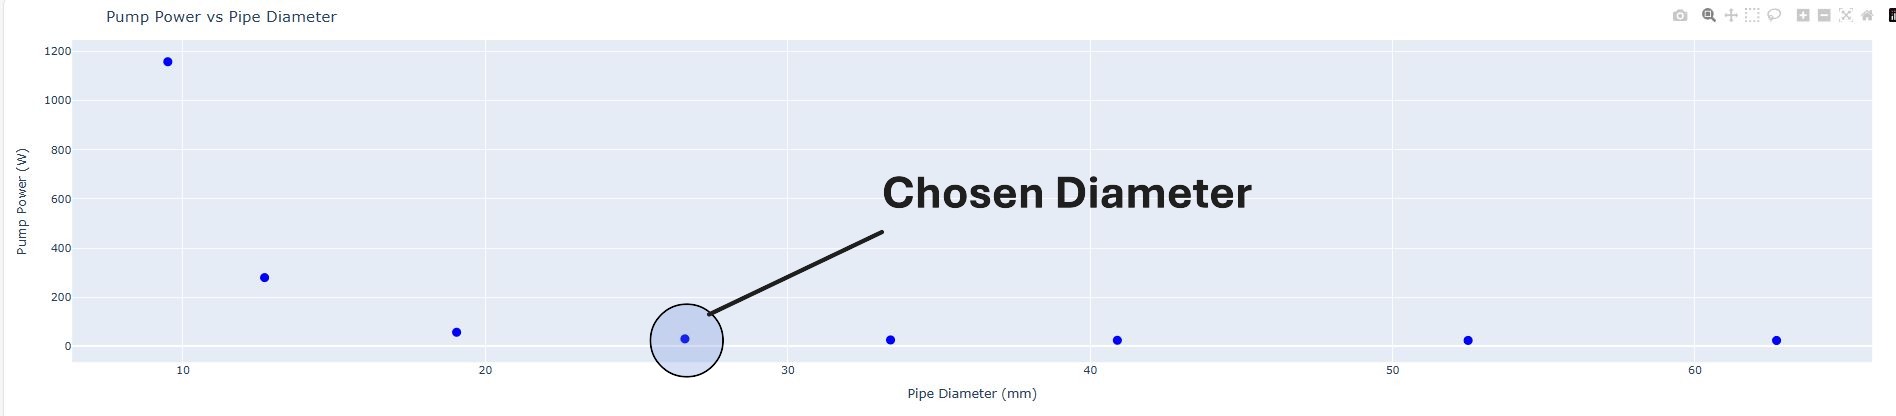
The flow rate at the pipe network outlet to the gutter system was calculated and fixed as a constant during the fluid mechanics analysis. This resulted in a clear relationship between pipe diameter and pump size. To visualize this relationship, a graph was generated for each pipe, considering only those diameters readily available in the market. This graph served as a critical tool for selecting the most suitable pipe and associated pump ratings, ensuring that the chosen components would operate harmoniously and cost-effectively to achieve the desired performance at the lowest cost possible. Below is the result for each of the pipes/pipe systems.
Refilling Tank A
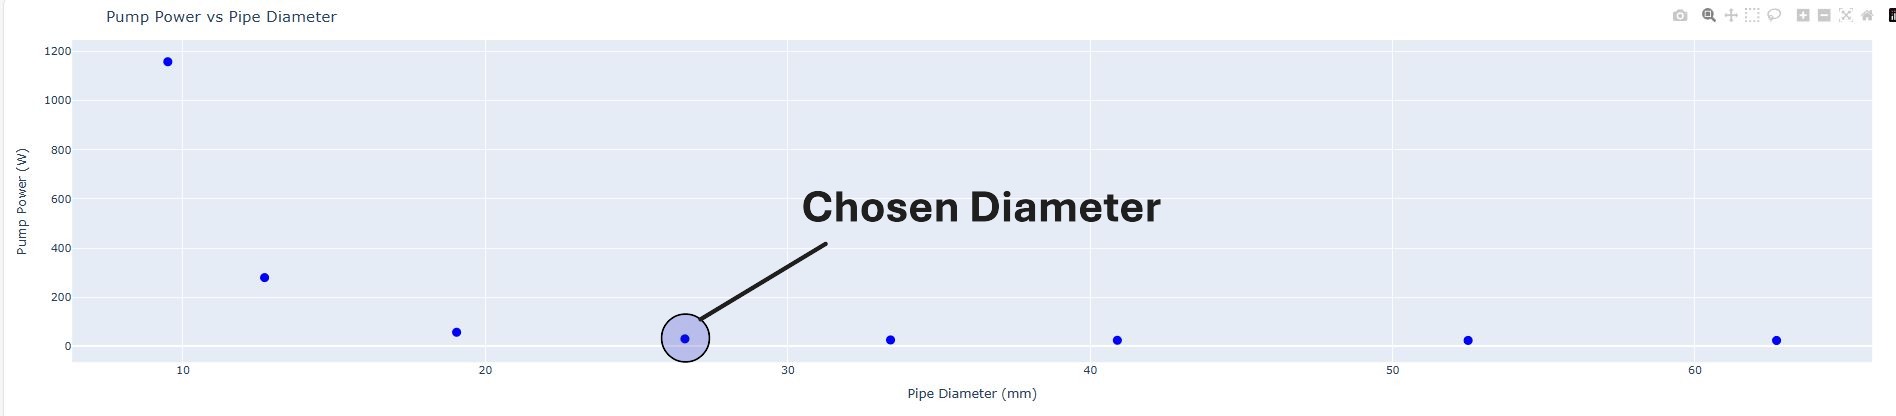
- Length (L): 5 m
- Flow Rate (Q): 0.00048 m³/s (0.48 L/s)
- Pipe Diameter (d): 26.6 mm
- Flow Speed: 0.86 m/s
- Reynolds Number (Re): 25,222.88 (indicating turbulent flow)
- Head Loss:
- Major Head Loss: 0.23 m
- Minor Head Loss: 0.10 m
- Elevation: 1.75 m
- Total Head Loss: 2.08 m
- Pump Specifications:
- Efficiency: 80%
- Power: 13.47 W
Pumping from Tank A to Reservoir (Tank B)
- Length (L): 3.5 m
- Flow Rate (Q): 0.0008 m³/s (0.8 L/s)
- Pipe Diameter (d): 26.6 mm
- Flow Speed: 1.44 m/s
- Reynolds Number (Re): 42,038.13
- Head Loss:
- Major Head Loss: 0.42 m
- Minor Head Loss: 0.19 m
- Elevation: 2.20 m
- Total Head Loss: 2.81 m
- Pump Specifications:
- Efficiency: 80%
- Power: 30.35 W
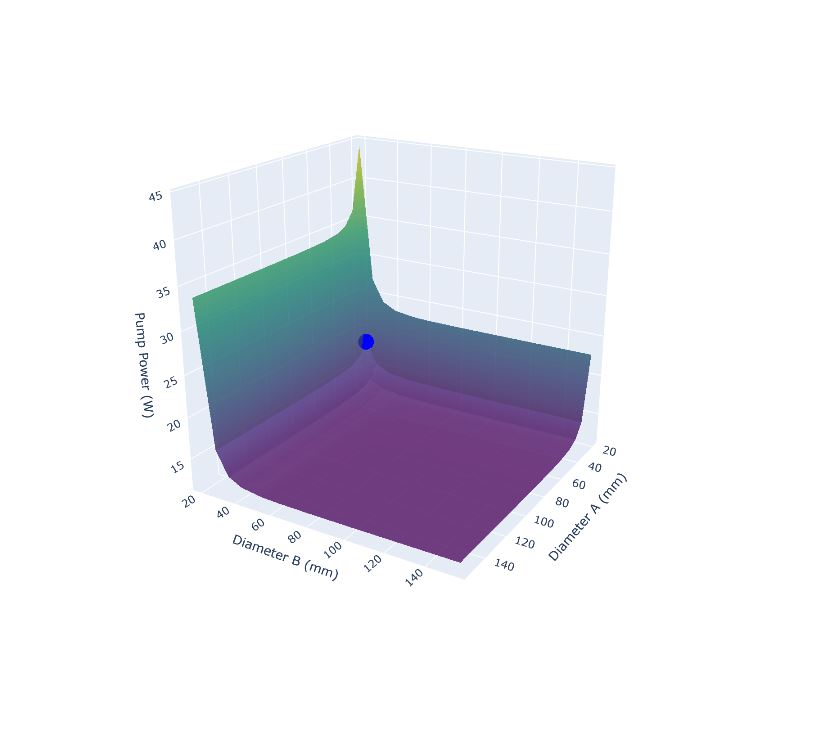
Reservoir to Gutter Units
- The pipe network from reservoir Tank B to the gutter units involves multiple connections and pipe diameters.
- Calculations were performed similarly, but with additional complexity due to the branching network, here the first pipe is called pipe A with subsequent branching following the pattern alphabetically.
- since the outlet pipes are directly related to required flow rate and the gutter inlet opening, its diameter and solution speed were set as constants respectively.
| PIPE A | PIPE B |
|---|---|
| Flow Rate (Q): 0.0003 m³/s (8 L/s) | Flow Rate (Q): 0.0003 m³/s (8 L/s) |
| Pipe Diameter (d): 26.6 mm | Pipe Diameter (d): 26.6 mm |
| Flow Speed: 0.54 m/s | Flow Speed: 0.54 m/s |
| Reynolds Number (Re): 15,764.30 | Reynolds Number (Re): 15,764.30 |
| Pressure: 34.4-50.6 kPa | Pressure: 27.4-43.5 kPa |
| Head Loss: | Head Loss: |
| - Major: 0.85 m | - Major: 0.09 m |
| - Minor: 0.19 m | - Minor: 0.56 m |
| - Elevation: 3 m | - Elevation: 0 m |
| Total Head Loss at A: 6.65 m | Total Head Loss at B: 5.56 m |
| PIPE C | Network A to C |
|---|---|
| Flow Rate (Q): 0.000012 m³/s (0.32 L/s) | Head Loss: |
| Pipe Diameter (d): 12.7 mm | - Major: 0.94 m |
| Flow Speed: 0.09 m/s | - Minor: 0.75 m |
| Reynolds Number (Re): 1,320.73 (Laminar Flow) | - Elevation: 3 m |
| Total Head Loss: 4.69 m | |
| Pump Specifications: | Pump Efficiency: 80% |
| Power: 18.96 W |
Precautions
- Safety Margins: Elevation values were increased to account for potential variations in pressure loss, ensuring reliable operation.
- Material Selection: Using corrosion-resistant materials (stainless steel) for tanks to withstand nutrient solutions.
- Automation and Monitoring: Implemented sensors and automation to monitor EC, pH, and flow rates
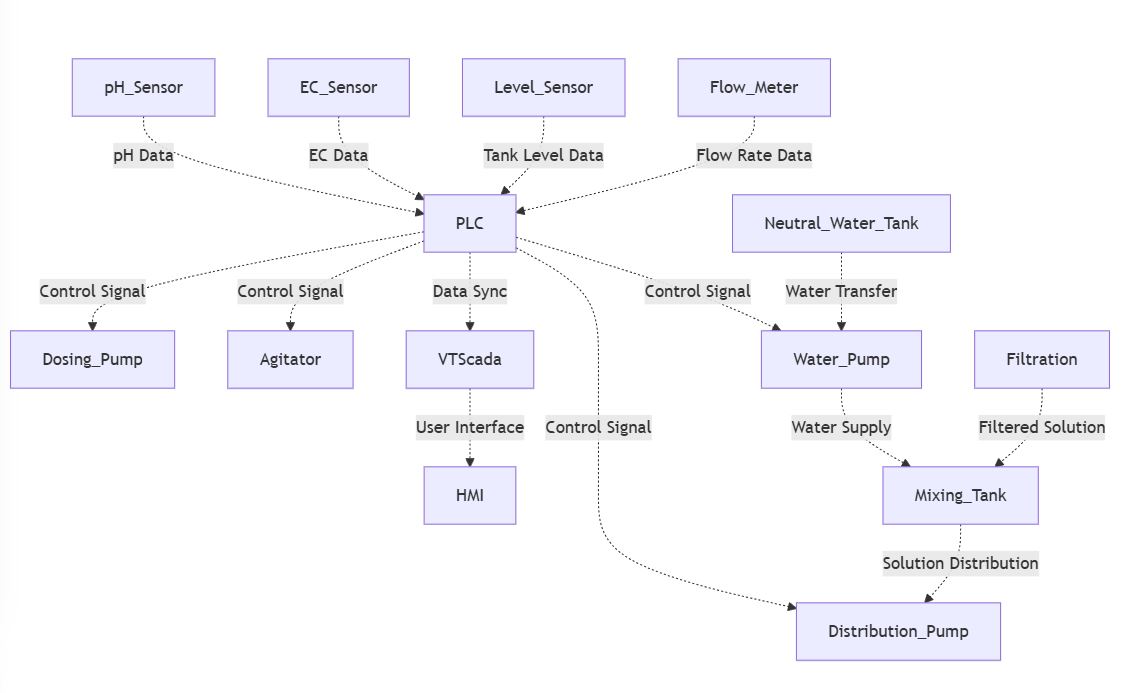
4.3 Logic control Schema
4.4 Cost Breakdown
| Component | Quantity | Unit Price ($) | Total ($) |
|---|---|---|---|
| SINAMICS V20 (variable frequency drive) | 4 | 135 | 540 |
| Siemens S7-1200 PLC | 1 | 1,317 | 1,317 |
| Expansion SM 1231 AI 8x13 Bit Analog Input | 2 | 250 | 500 |
| SM 1232 AQ 4x14 Bit Analog Output | 2 | 500 | 1000 |
| CM 1241 RS485 module (MODBUS COM) | 1 | 240 | 240 |
| (W)MD-30R(T) ikawi pump | 4 | 384 | 1,536 |
| Burkert 6281 (Direct-Acting) servo controlled valve | 5 | 25 | 125 |
| Siemens SITRANS FM MAG DN-25 flow meter | 5 | 300 | 1,500 |
| VEGAPULS Liquid measuring sensor | 2 | 320 | 640 |
| Micro controllers | 3 | 120 | 360 |
| Wiring and components (estimated) | 1 | 300 | 300 |
| Total | 8,058 | ||
| Component | Quantity | Unit Price ($) | Amount ($) |
|---|---|---|---|
| Bluelab Pro Controller Wi-Fi In stock SKU BCTPRC02 |
1 | 1,350 | 1,350 |
| Bluelab PeriPod M3 | 1 | 1,107 | 1,107 |
| Bluelab pH Probe 5M | 1 | 89 | 89 |
| Bluelab Pro Controller Conductivity Probe | 1 | 61 | 61 |
| Acid Tubing (White) Suitable for Bluelab PeriPod | 1 | 80 | 80 |
| Bluelab Probe Care Kit – pH and Conductivity | 1 | 29 | 29 |
| Autogrow IntelliClimate Kit | 1 | 1,588 | 1,588 |
| Total | 4,304 | ||
| or | |||
| Four-ring EC/TDS Probe with Internal Temperature Sensor | 1 | 2,300 | 2,300 |
| EasyFerm Bio pH Sensor | 1 | 1,750 | 1,750 |
| 1413 µS/cm Conductivity Standard in Light Block Bottle (500mL) | 1 | 40 | 40 |
| Cole-Parmer Masterflex L/S Series | 2 | 1,900 | 3,800 |
| Watson Marlow 520Di Peristaltic Pump | 1 | 1,400 | 1,400 |
| SenseAir S8 co2 sensor | 1 | 30 | 30 |
| Alicat Scientific MC Series flow meter | 1 | 200 | 200 |
| Dispensing Nozzle | 1 | 40 | 40 |
| Burkert 6011 valve | 1 | 80 | 80 |
| Siemens Coriolis Flowmeter SITRANS FC430 Flowmeter | 3 | 300 | 900 |
| Total | 10,540 | ||
| Component | Quantity | Unit Price (₦) | Total (₦) |
|---|---|---|---|
| 120m 1 inch PVC pipe | 50 | 2,200 | 110,000 |
| 40m 1/2 inch PVC pipe | 15 | 1,800 | 27,000 |
| Stainless steel 2mm | 10 | 150,000 | 1,500,000 |
| Hollow Quad Pipe (Stainless 50 X 20 X 2 mm) | 4 | 50,000 | 200,000 |
| Hollow Circular Pipe (Stainless) | 4 | 25,000 | 100,000 |
| Labour + fixtures | 1 | 500,000 | 500,000 |
| Total | 2,437,000 | ||
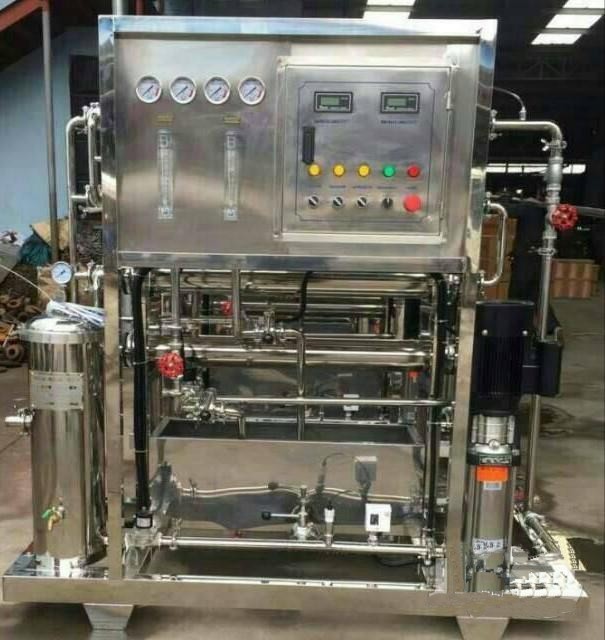
- water from the ground tends to be contaminated with all kind of natural salts, molecules, and elements. To acquire neutral water, the water will pass through a reverse osmosis process with the help of the purification machine shown in figure 14 below. The price varies at about ₦4,000,000.
 </p>
</p>
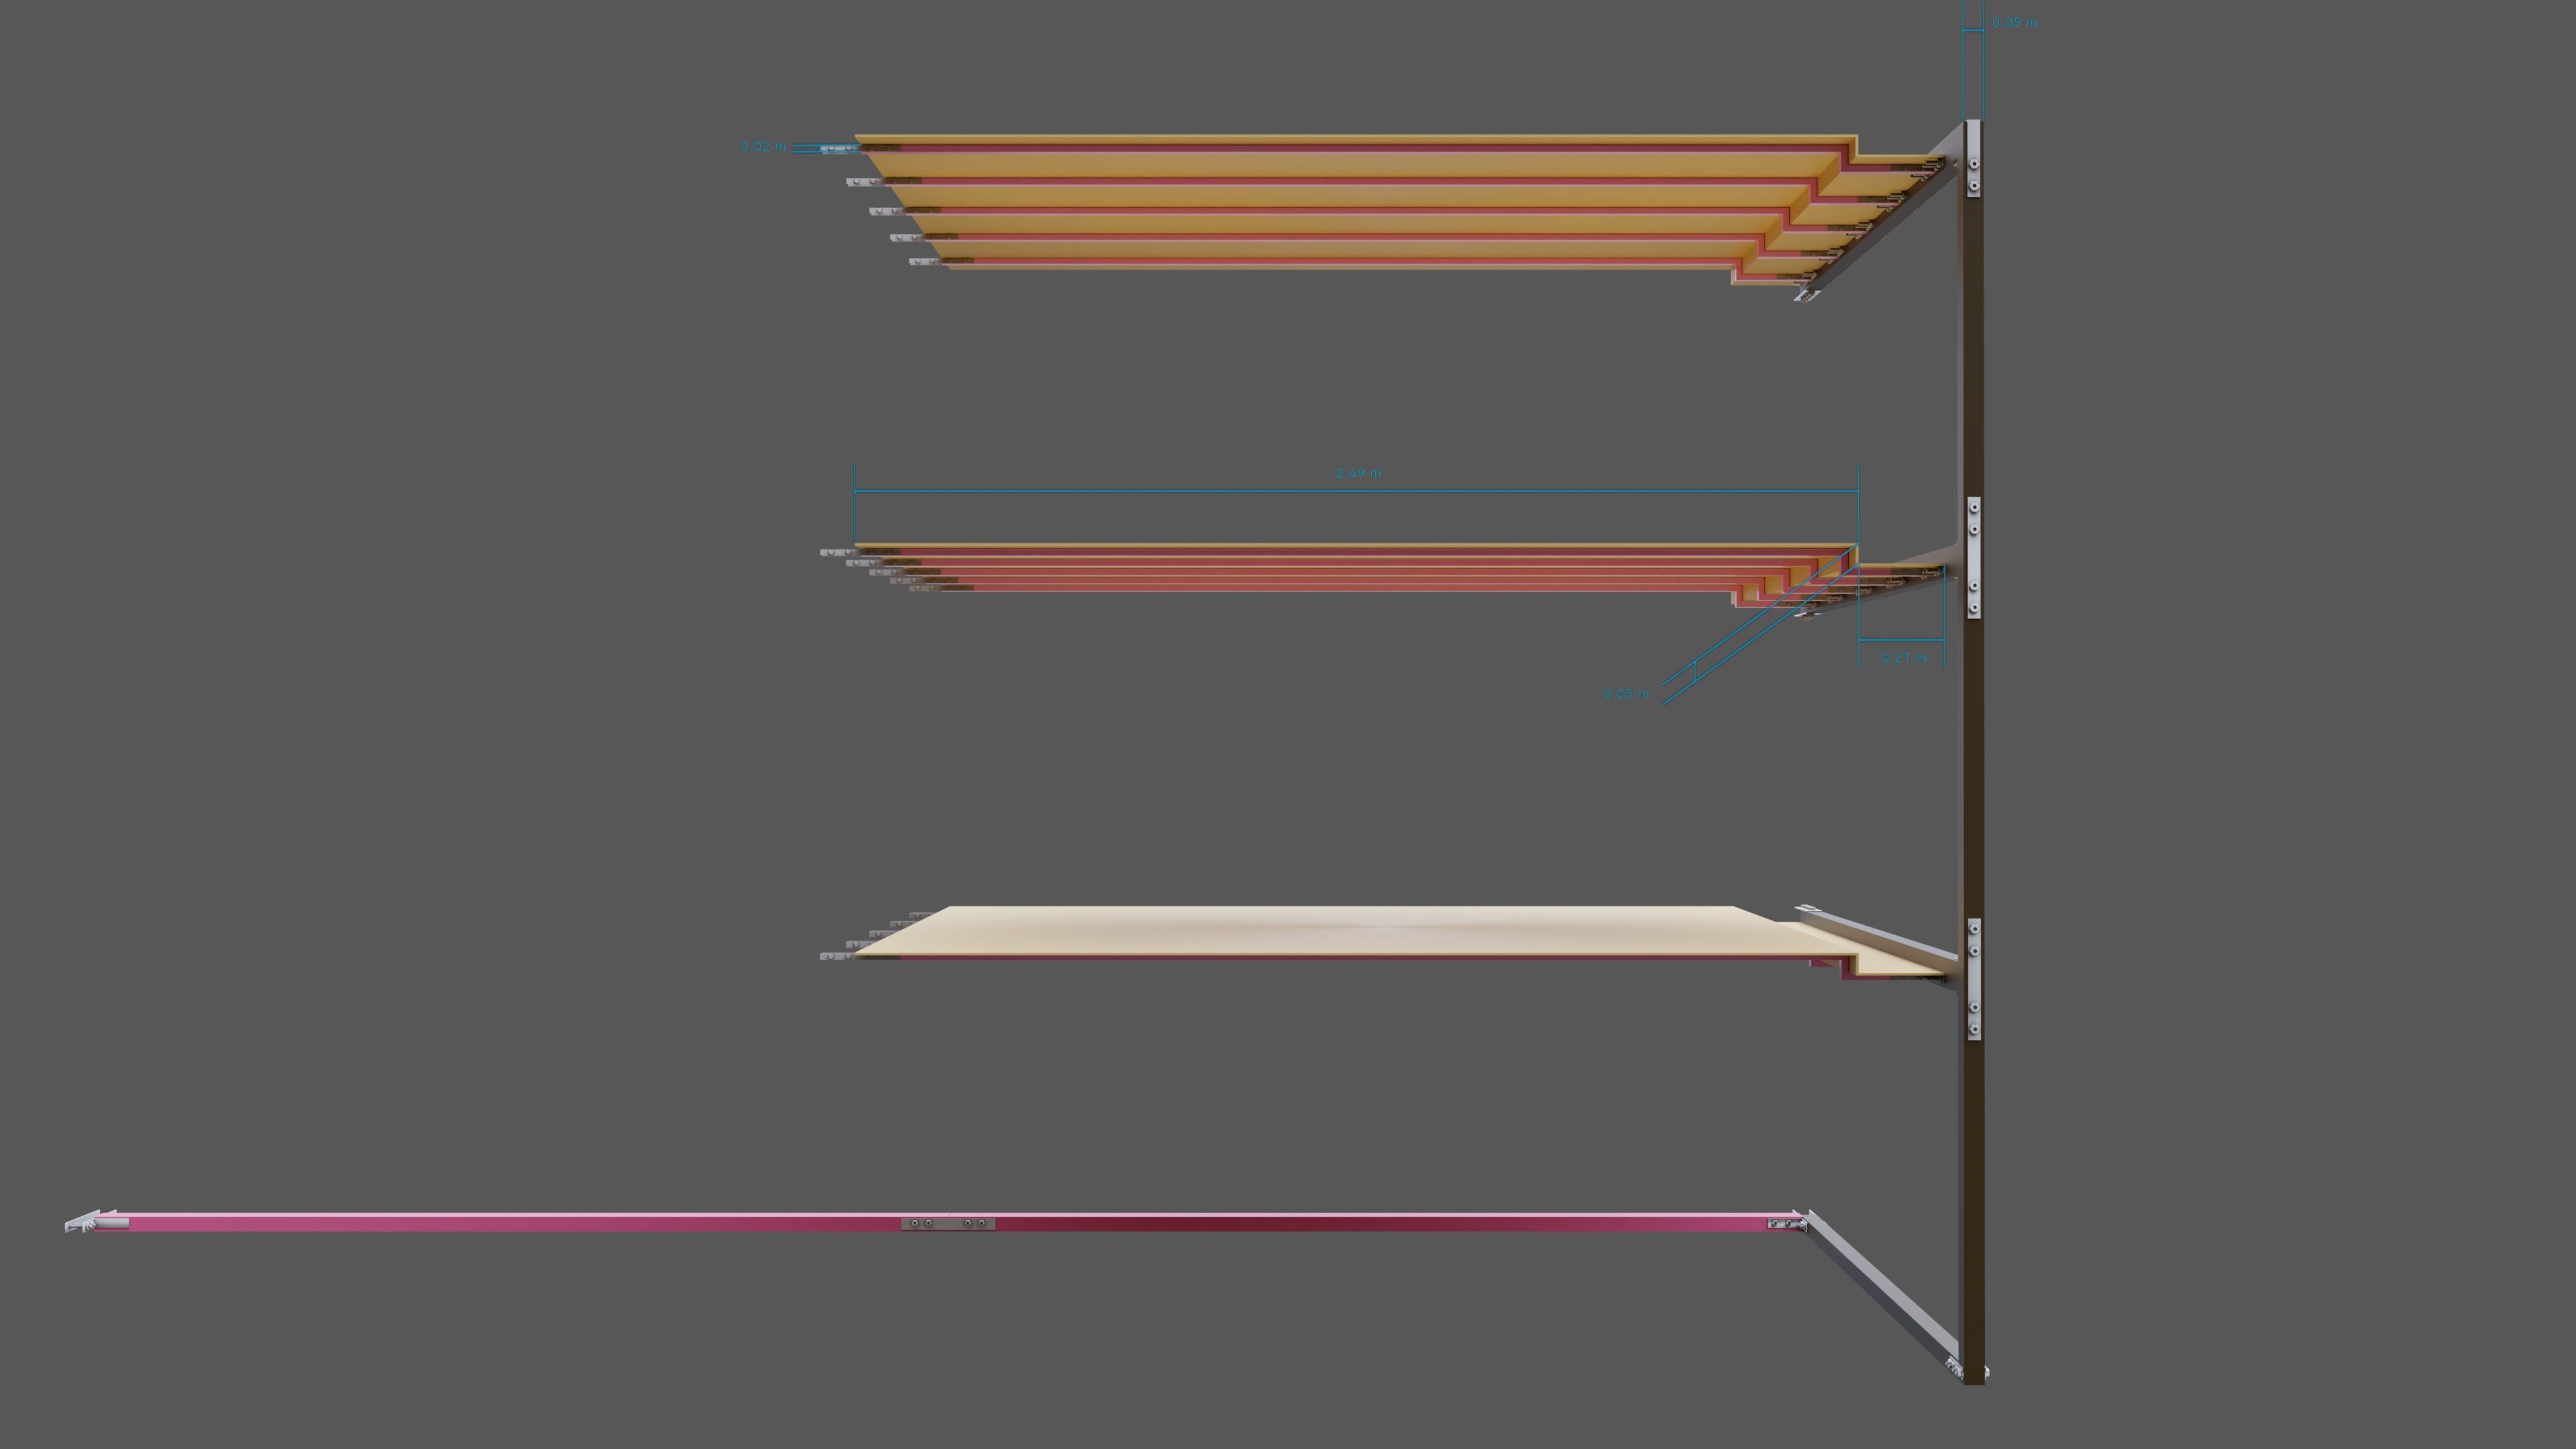
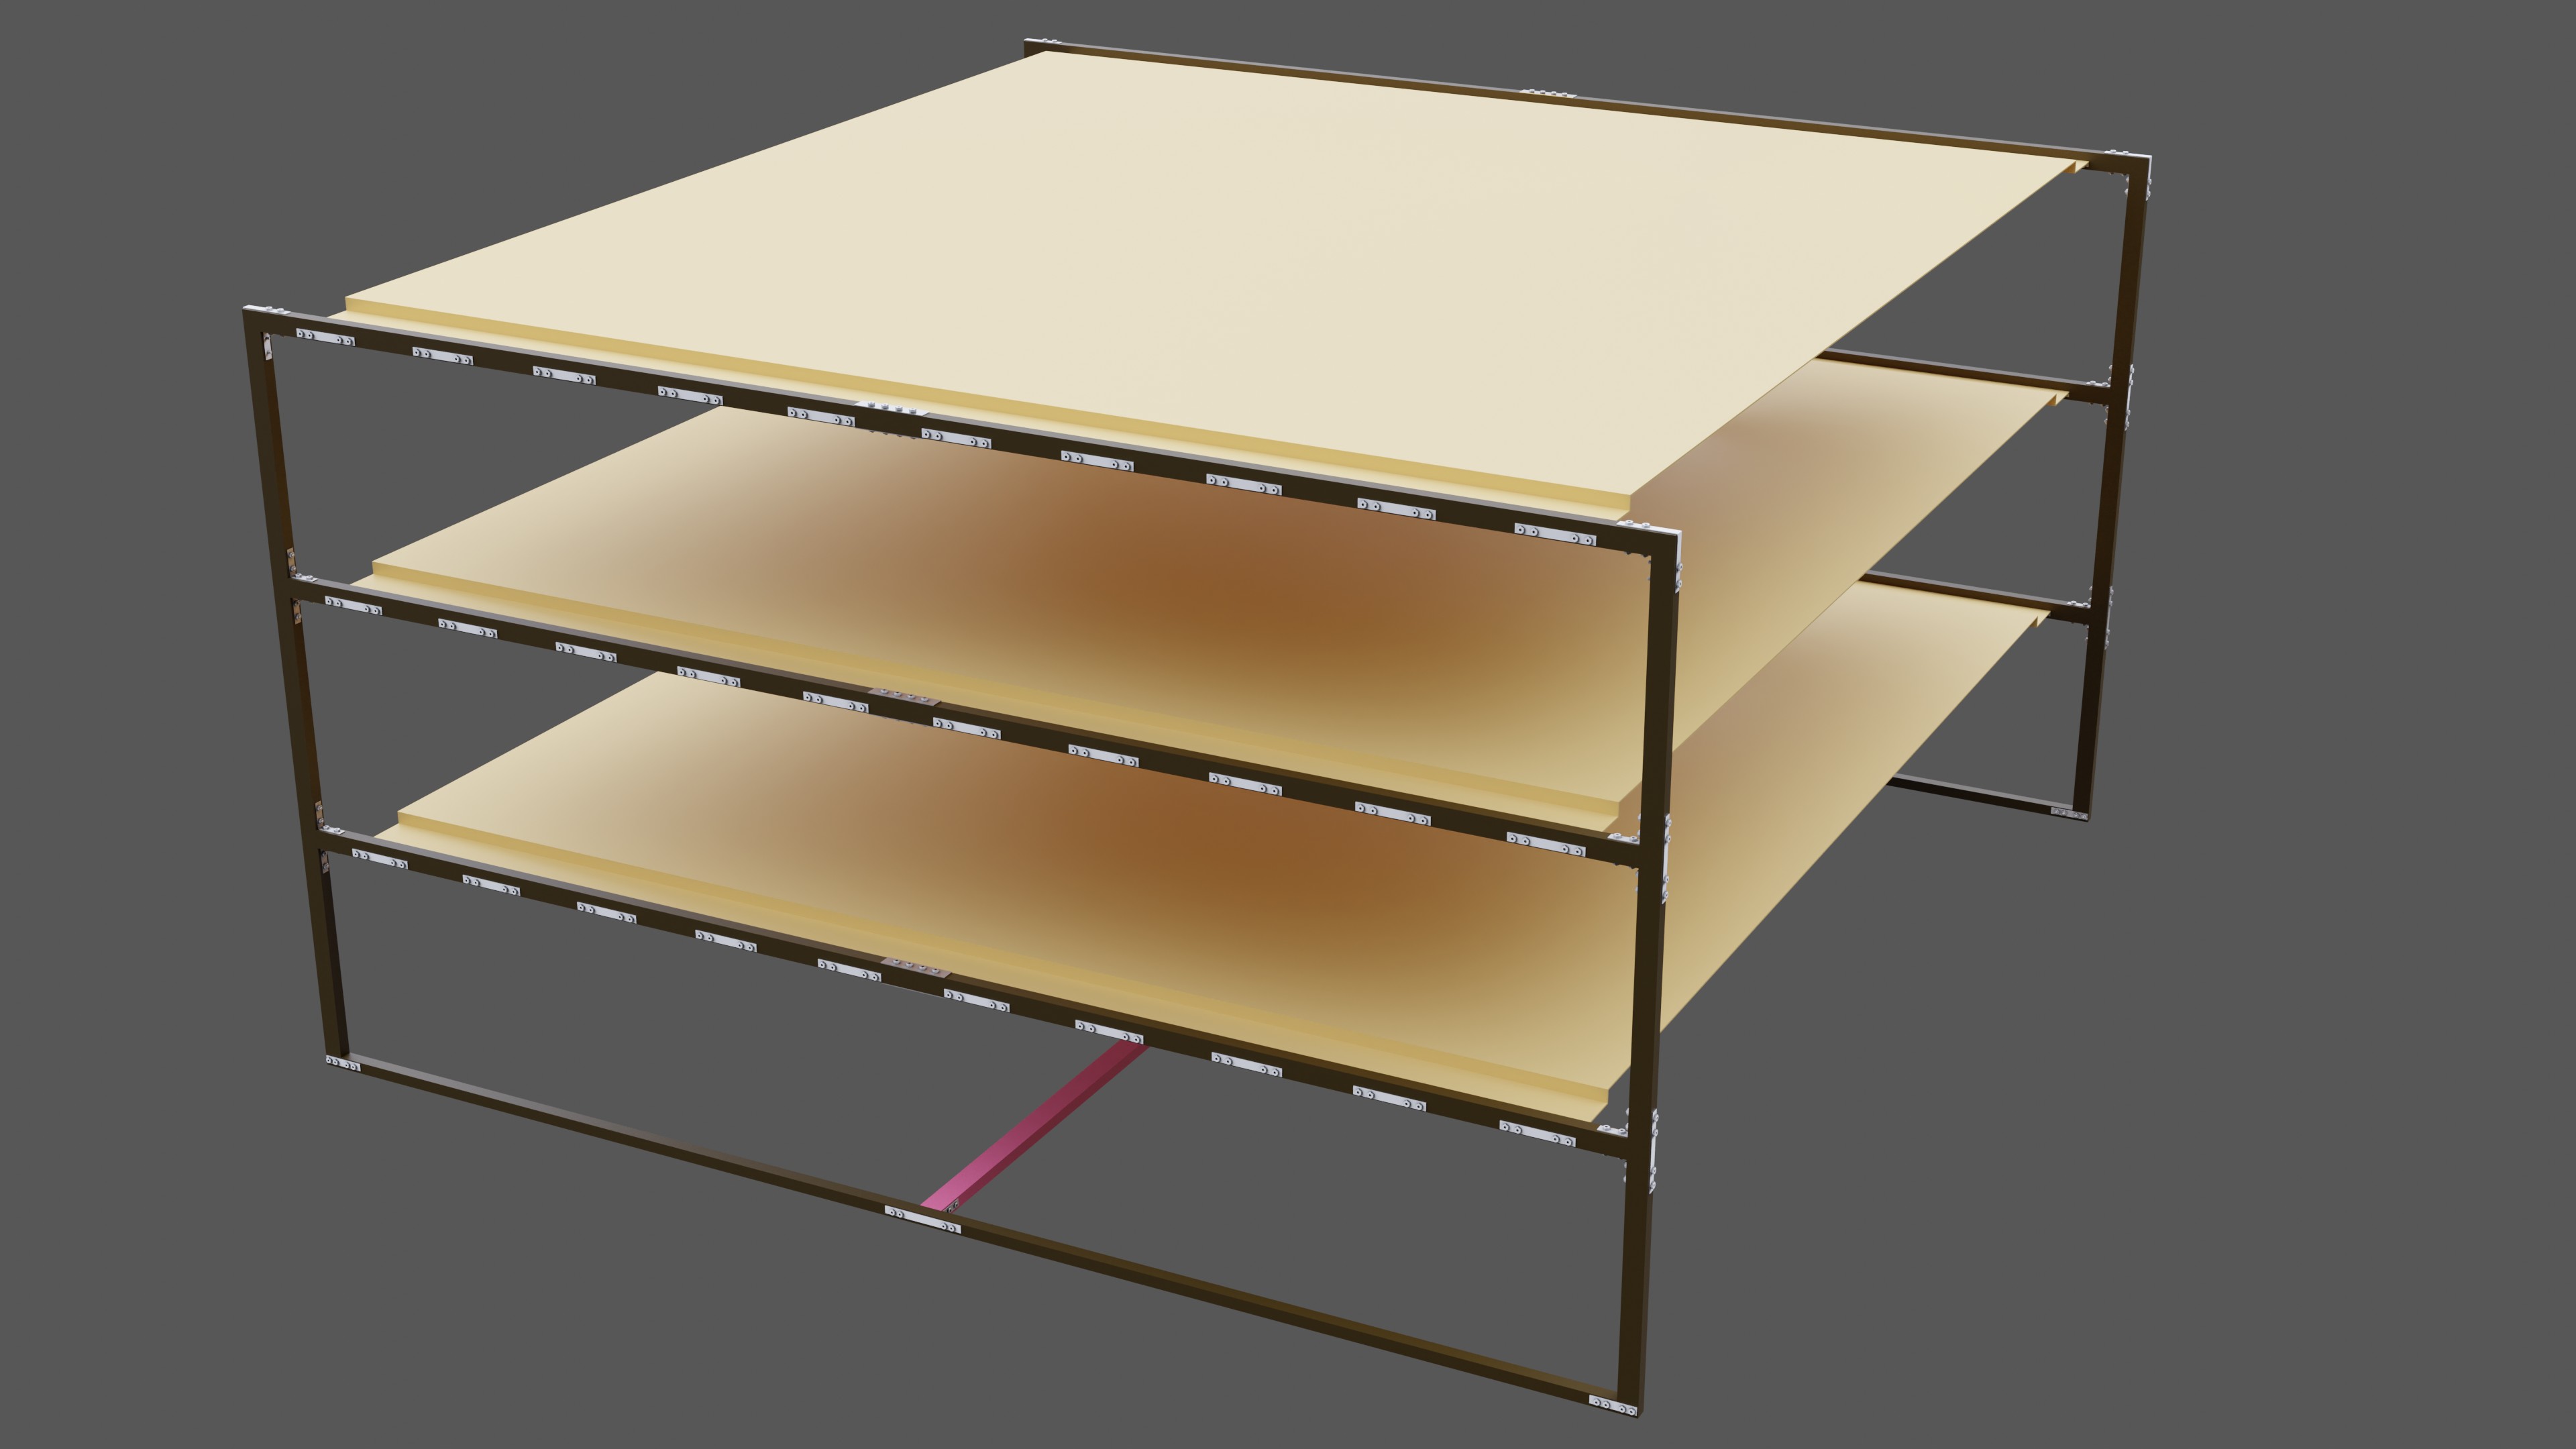
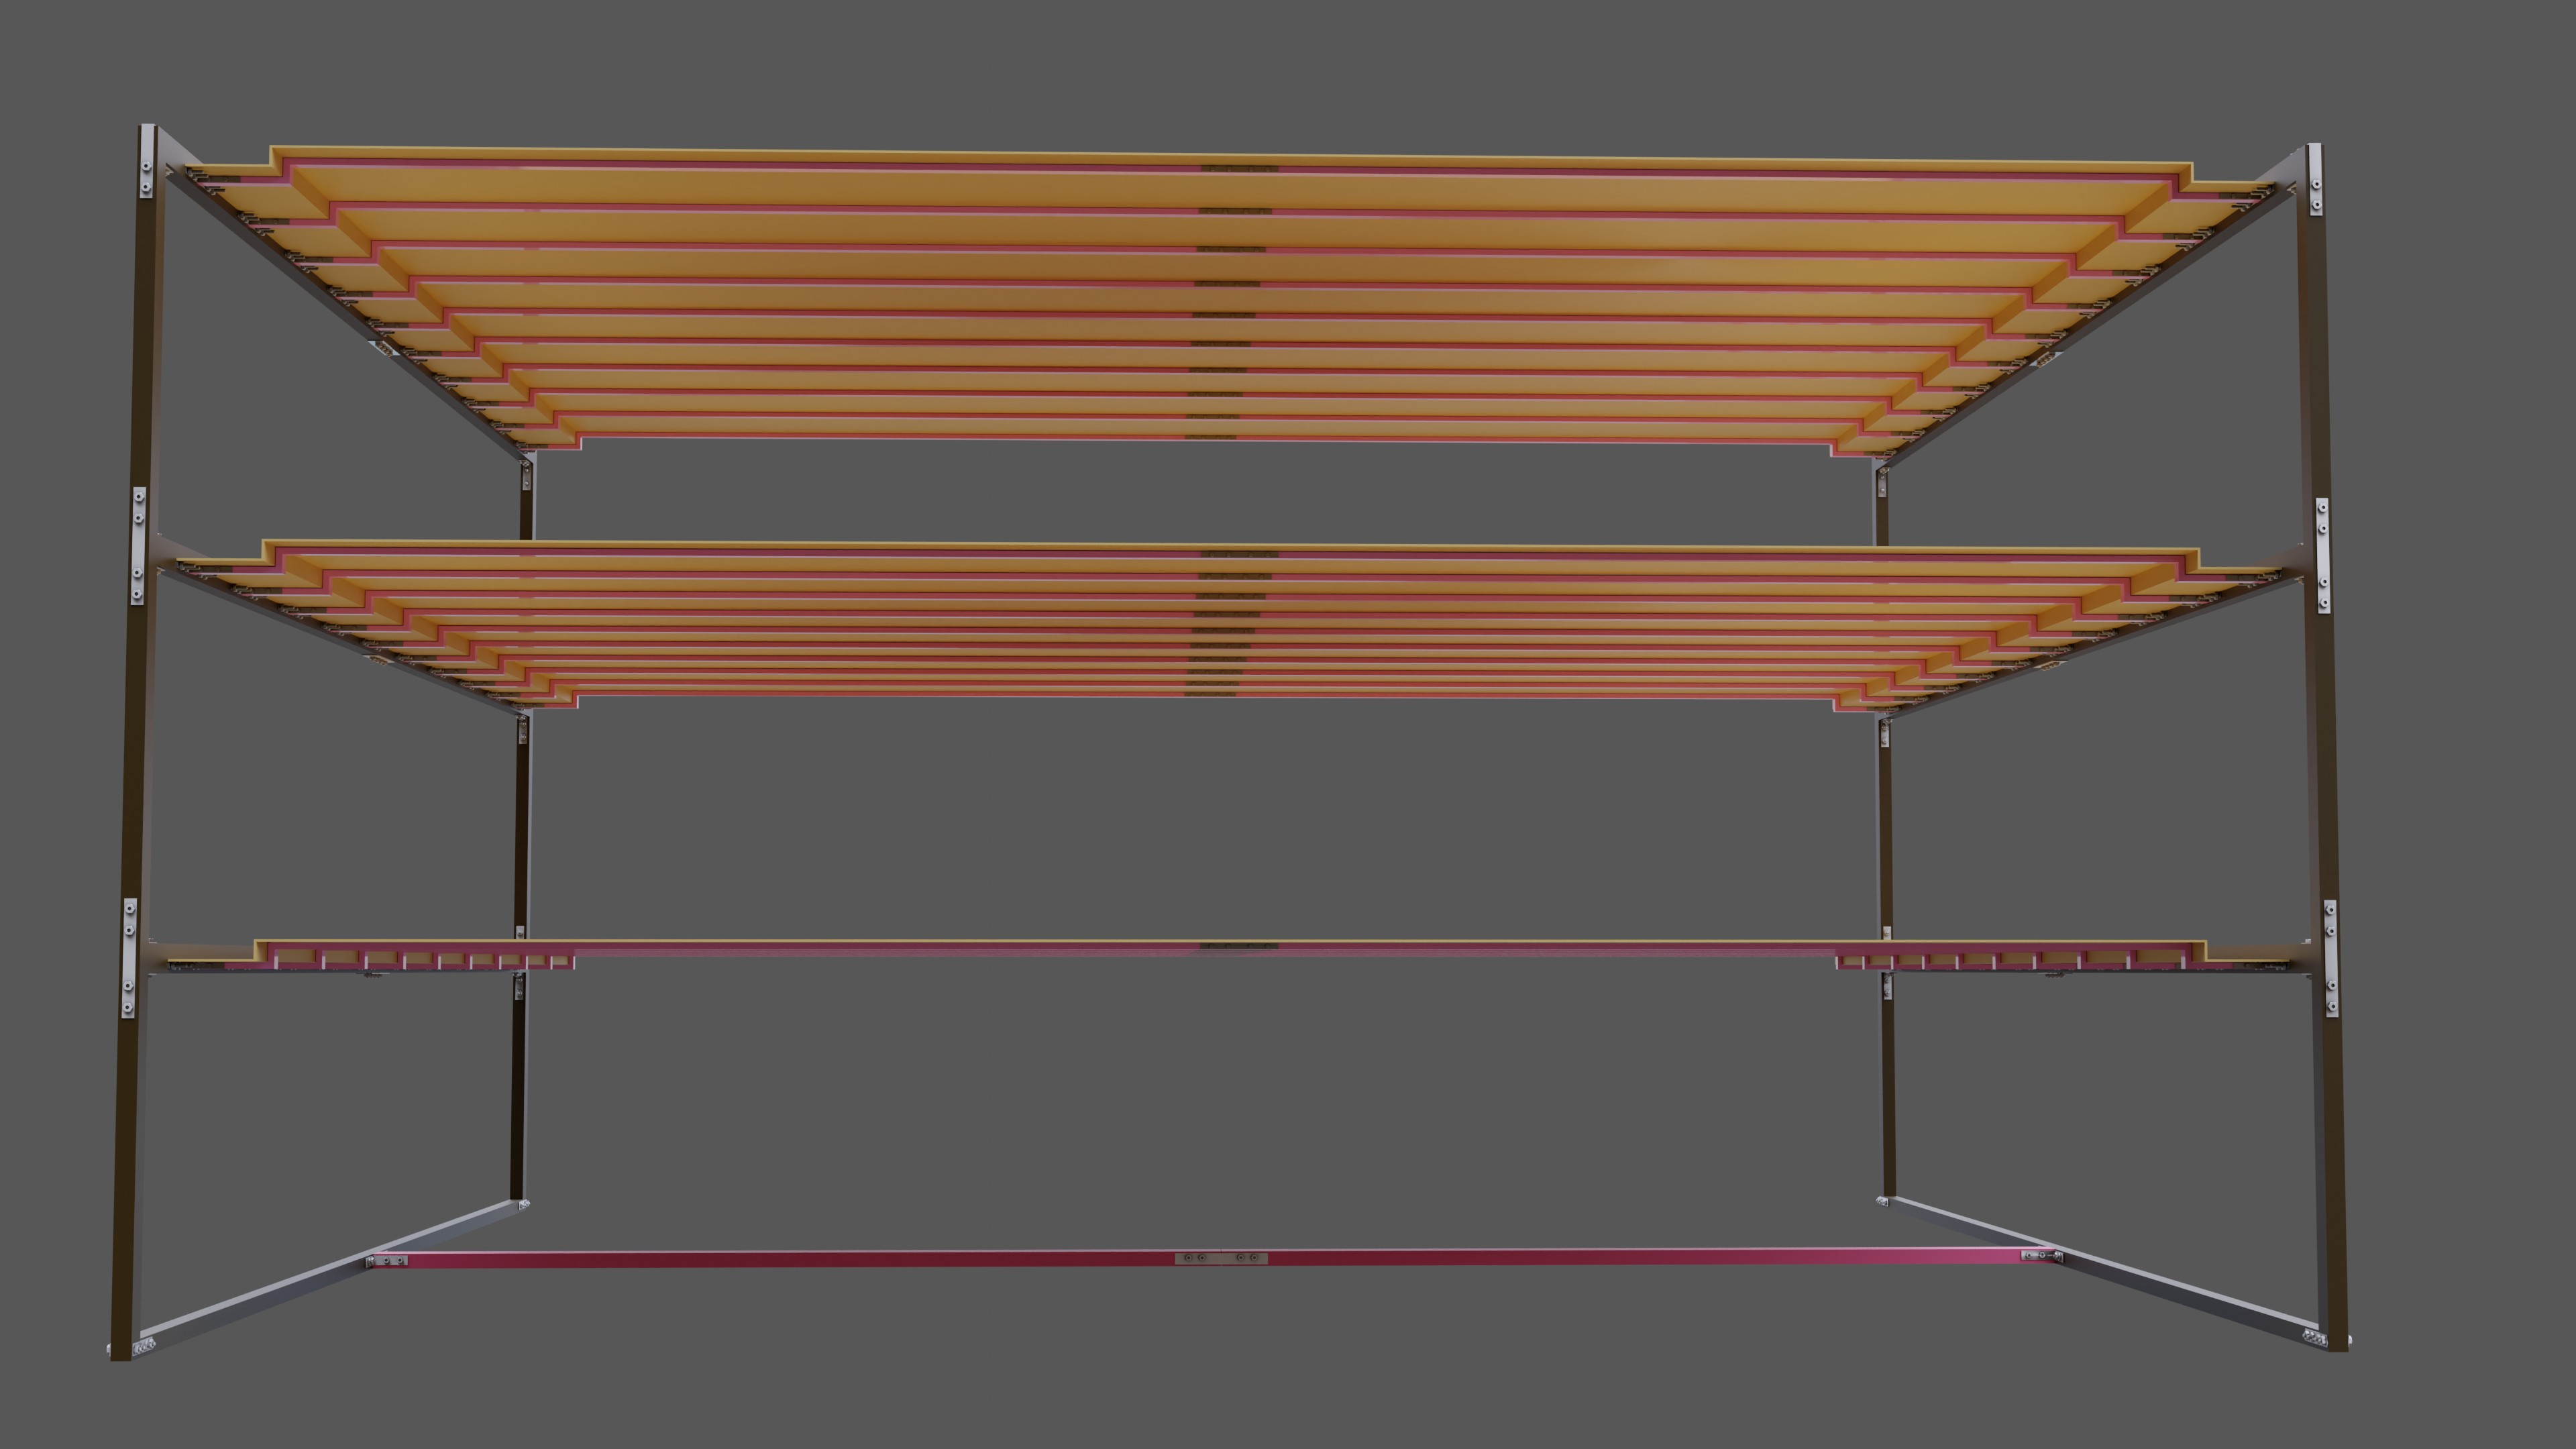
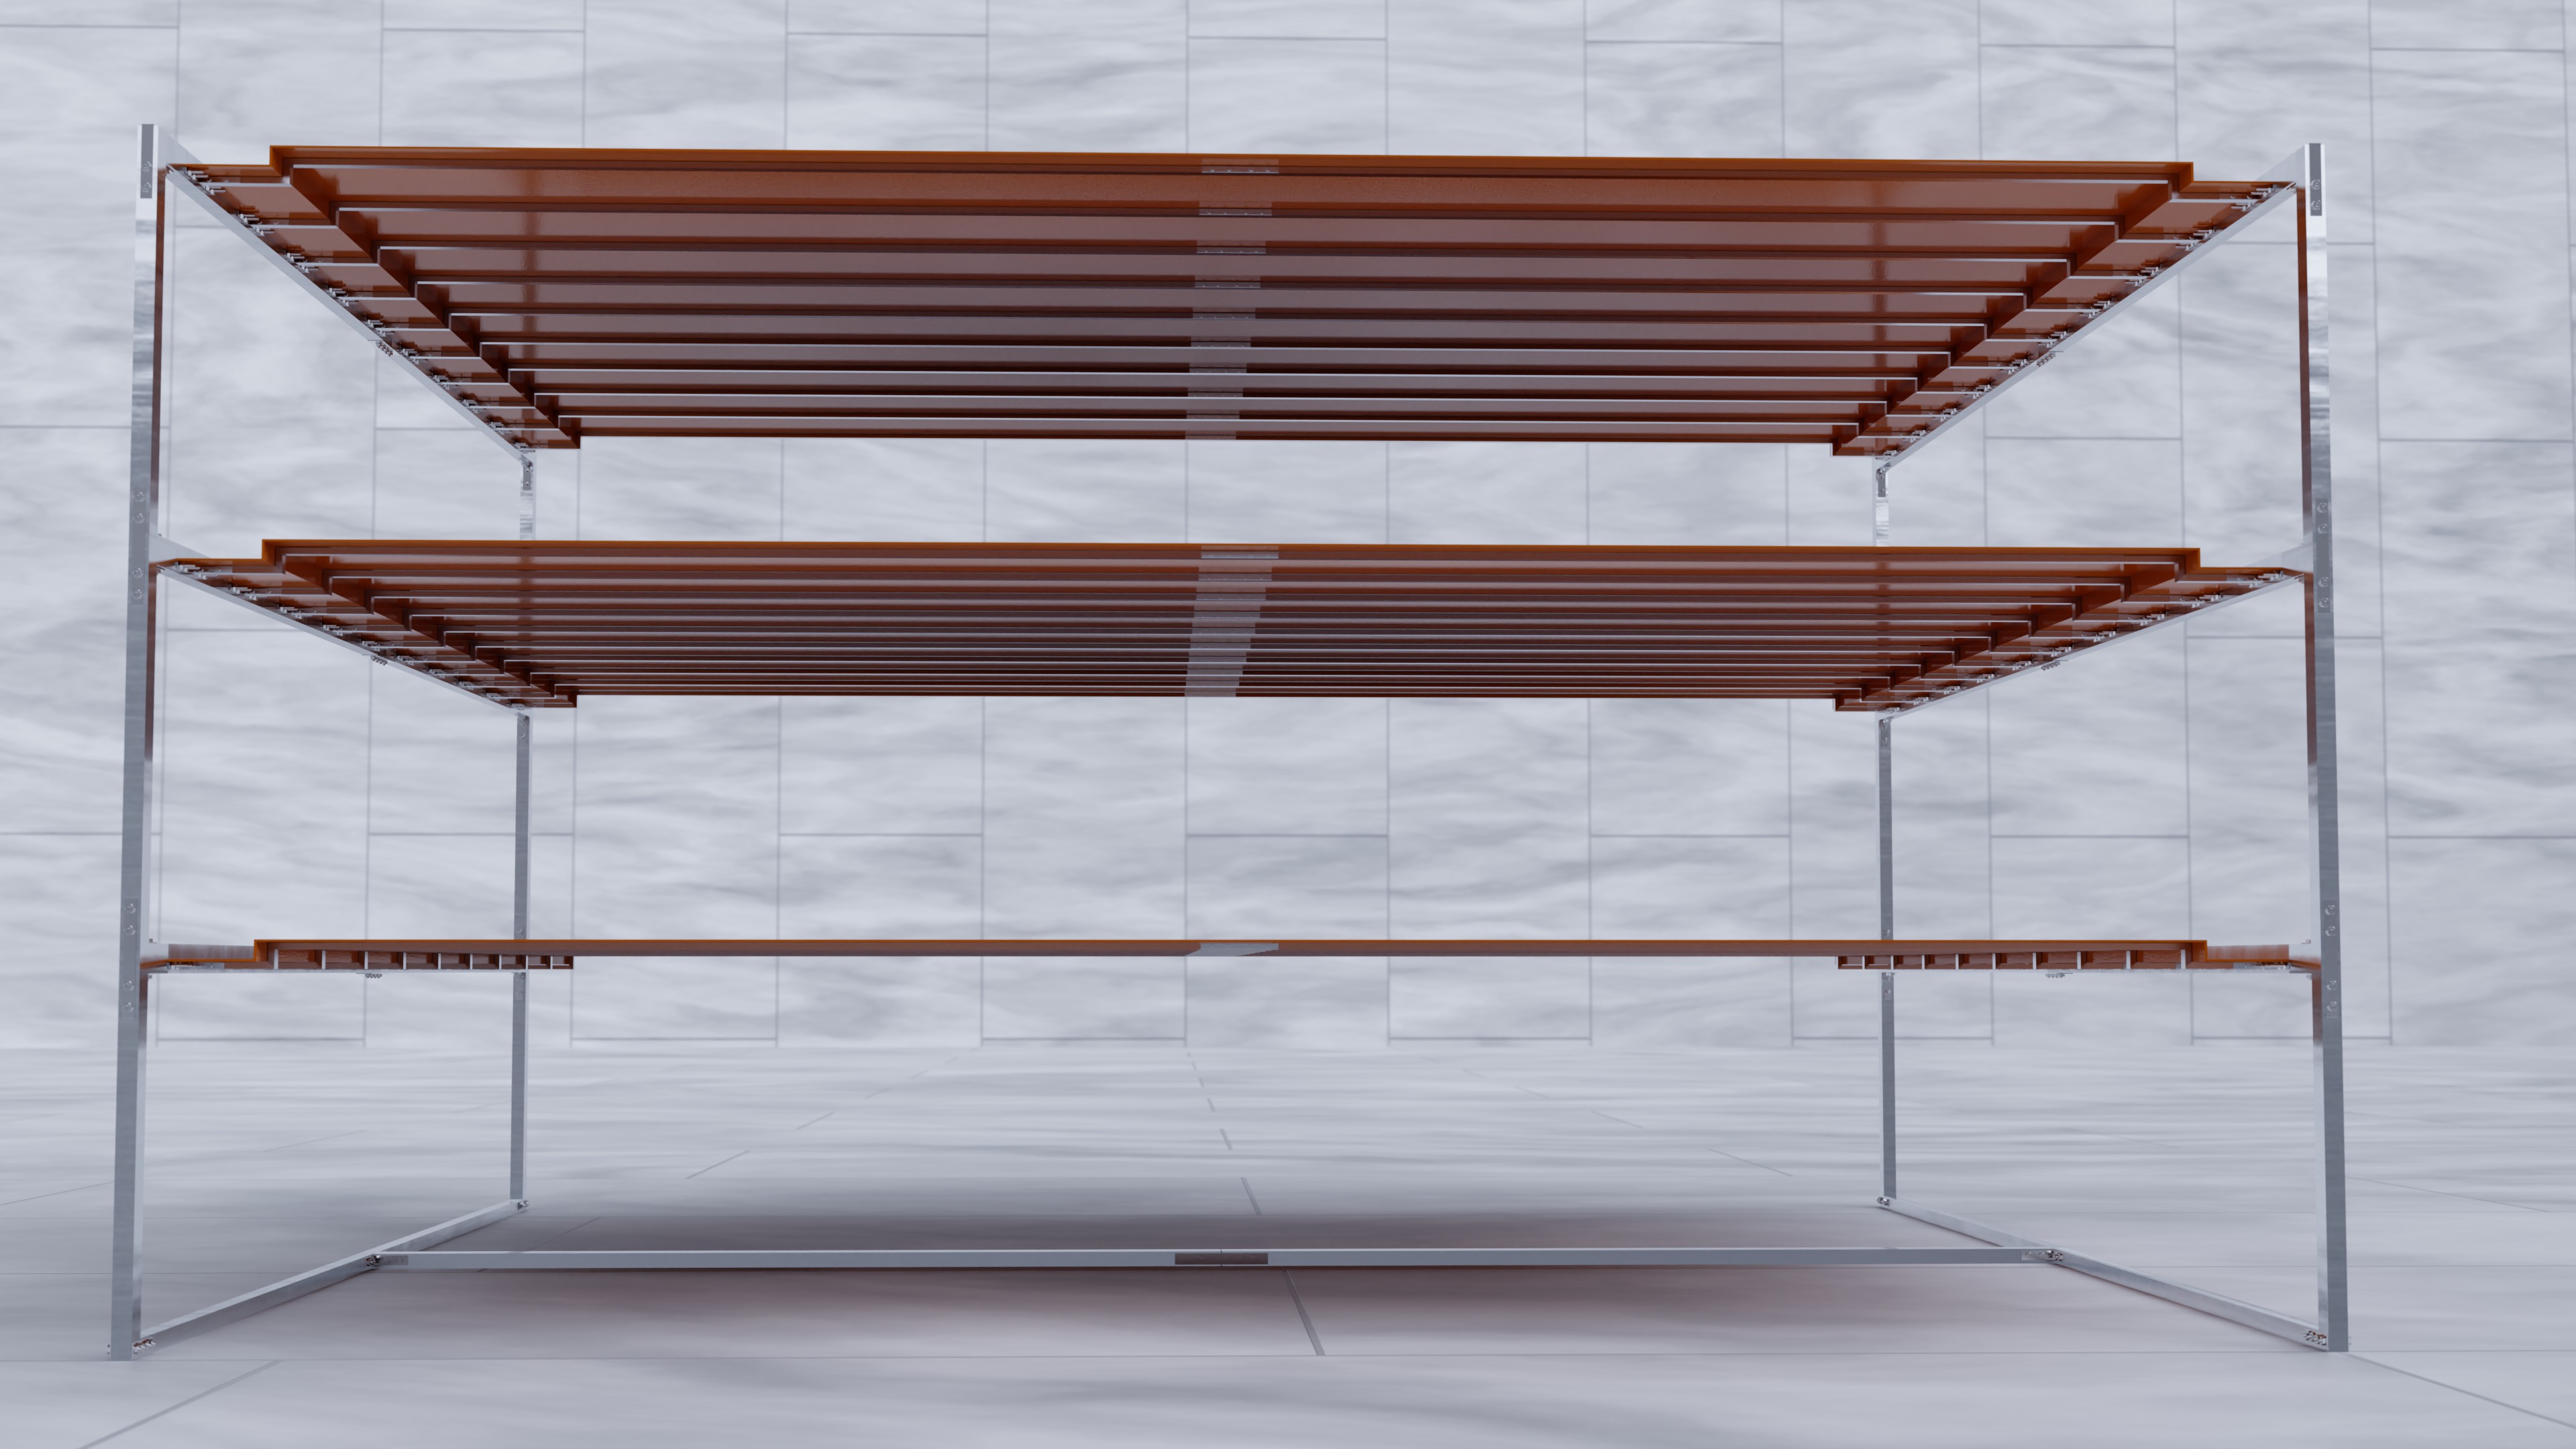
5.0 Gutter Framework
 </p>
</p>
Description
The gutter framework, made of stainless steel, will support the plant beds and ensure proper drainage. It is designed to be durable, easy to clean, capable of reassembly, and resistant to corrosion.
5.1 Cost Breakdown
| Description | Specification | Qty | Unit Price (₦) | Amount (₦) |
|---|---|---|---|---|
| Hollow Quad Pipe (Stainless) | 50 X 50 X 2 mm | 12 | 100,000 | 1,200,000 |
| Hollow Quad Pipe (Stainless) | 50 X 20 X 2 mm | 32 | 50,000 | 1,600,000 |
| Hollow Circular Pipe (Stainless) | D10mm X 2m | 24 | 25,000 | 600,000 |
| Hollow Circular Pipe (Stainless) | D20mm X 2m | 6 | 35,000 | 210,000 |
| Sheet (Stainless) | 2.5 X 2.4 X 1.2 m | 24 | 215,000 | 5,160,000 |
| Angle Iron (Stainless) | 3mm | 4 | 155,000 | 620,000 |
| Bolt/Nut (Stainless) | M40 X 70 | 1,000 | 1,200 | 1,200,000 |
| Roller Tyres (Stainless) | R20 | 4 | 16,000 | 64,000 |
| Bearings (Stainless) | R20 | 2 | 6,000 | 12,000 |
| Flat Bar (Stainless) | 4m X 6m X 3mm | 6 | 120,000 | 720,000 |
| Total | 11,386,000 | |||
6.0 HVAC System
Description
The HVAC (Heating, Ventilation, and Air Conditioning) system will regulate temperature, humidity, and air quality within the vertical farm. It is essential for maintaining optimal growing conditions for the plants.
6.1 Cost Breakdown
| Item | Model | Qty | Description | Capacity (Kw) | Unit Price ($) | Total Price ($) |
|---|---|---|---|---|---|---|
| VRF Outdoor Units | ||||||
| 1 | 4TVVT192DD07CAA | 1 | Trane/20HP TVR 7G Modular Cooling Only | 56.00 | 7,011.49 | 7,011.49 |
| VRF Indoor Units | ||||||
| 2 | 4TVBD009AB07RAA | 1 | Trane TVR 7G Compact Four-way Cassette Unit | 2.80 | 395.78 | 395.78 |
| 3 | 4TVCD038AB07RAA | 1 | Trane TVR 7G Four-way Cassette Unit | 11.20 | 704.10 | 704.10 |
| 4 | 4TVCD055AB07RAA | 3 | Trane TVR 7G Four-way Cassette Unit | 16.00 | 880.91 | 2,642.74 |
| Branch Distributors & Accessories | ||||||
| 5 | 4TV0RDK01CA007G | 1 | Trane/IDU Y Joint, kW < 22.4 | - | 34.69 | 34.69 |
| 6 | 4TV0RDK03CA007G | 3 | Trane/IDU Y Joint, 33≤ KW < 104 | - | 69.96 | 209.87 |
| Total Price (USD) | $10,998.67 | |||||
| Total Price (NGN) | ₦17,597,866.00 | |||||
| VAT (7.5%) | ₦1,319,839.95 | |||||
| Grand Total | ₦18,917,705.95 | |||||
7.0 Specialized Lighting System
Description
The specialized lighting system will provide the correct spectrum of infrared and visible light to promote optimal plant growth. The lights will be energy-efficient and adjustable to meet the needs of different crops.
7.1 Cost Breakdown
| Component | Quantity | Unit Price ($) | Amount ($) |
|---|---|---|---|
| GreenPower LED production module | 42 | 500 | 21,000 |
| Ethernet Switch (24-port) | 2 | 100 | 200 |
| Ethernet Cables | 42 | 7 | 294 |
| GrowWise Control System (optional) | - | - | - |
| Total | 21,494 | ||
8.0 Overheads
Description
The selection of personnel for the vertical farm is based on a balance of technical expertise, agricultural knowledge, and operational efficiency. Engineers specializing in fabrication, control systems, and electrical work ensure the structural integrity, automation, and power management of the farm.
8.1 Cost Breakdown
| Employee Role | Monthly Salary (₦) | Contract Duration | Employment Type | Total Salary (₦) |
|---|---|---|---|---|
| Mechanical Engineer (Fabrication) | 300,000 | 6 months | Full-time | 1,800,000 |
| Professor in Agriculture (Horticulture) | 250,000 | 4 months | Part-time | 1,000,000 |
| PhD Student (Agriculture) | 180,000 | 4 months | Full-time | 720,000 |
| PhD Student (Agriculture) | 180,000 | 4 months | Full-time | 720,000 |
| Lab Assistant | 120,000 | 4 months | Full-time | 480,000 |
| Control Systems Engineer | 300,000 | 5 months | Full-time | 1,500,000 |
| Electrical Engineer | 260,000 | 3 months | Full-time | 780,000 |
| Total | 7,000,000 | |||
9.0 Nutrient solution compounds
Description
in the following, we shall break down the required compounds for the production of lettuce and use the data to find a suitable fertilizer
9.1 Nutrient Requirements/ Fertilization
Lettuce requires a well-balanced nutrient solution containing:
- Nitrogen (N) - for leafy growth
- Phosphorus (P) - for root development
- Potassium (K) - for plant vigor and disease resistance
- Calcium (Ca) - to prevent tip burn
- Magnesium (Mg) - essential for chlorophyll production
- Micronutrients such as iron (Fe), zinc (Zn), manganese (Mn), and boron (B)
- The EC (Electrical Conductivity) of the nutrient solution should be maintained at 1.2 - 2.0 mS/cm, and the pH should be adjusted to 5.5 - 6.5 for optimal nutrient uptake.
| Parameter | Supplemental water (ppm) | Nutrient solution (ppm) |
|---|---|---|
| N | 0.15 | 129.18 |
| P | 0.31 | 48.32 |
| K | 4.81 | 183.23 |
| S | 8.77 | 52.10 |
| Ca | 37.67 | 136.52 |
| Mg | 10.54 | 32.68 |
| Based on the Nitrogen (N), Phosphorus (P), and Potassium (K) ratios obtained from the practical data in Table 11, an NPK ratio of **129.18 | 48.32 | 183.23** or **2.673 | 1 | 3.794** was determined. Given the availability of water-soluble fertilizers suitable for hydroponics, a standard **3 | 1 | 4** ratio can be used. |
Each head of lettuce requires 5 liters of water throughout its life cycle. In the pilot-scale project, 2,450 heads of lettuce are evenly distributed over 75 m², resulting in a total water usage of 12,250 liters.
Several commercially available fertilizers meet the required NPK ratio, with a maximum cost of $20 per kg, including Sulfur (S), Calcium (Ca), Magnesium (Mg), and various micronutrients.
Note: The fertilizer referenced represents the highest quality and most premium option. For the full-scale project, a custom-blended formulation will be produced in-house by the resident professor of agriculture, at a cost approximately five times lower.
Given the total water requirement, the amount of fertilizer needed is:
12,250 L ÷ 1,000 = 12.25 kg ==> 13kg
9.2 Cost Breakdown
- The total fertilizer cost at the premium price point would be:
13 Kg × 20 $/Kg = USD 260
-
2475 lettuce seed are required. the most suitable size available on the market is the 5000 seed bag of premium Salanova Expertise RZ lettuce at USD 280.
-
The cost of 250 Rockwool Plugs is USD 10. 13 packs should suffice with a little extra for contingency, totaling USD 130.
10.Cost & Profit Projections
Description
In the following analysis, the projected profits for both the pilot-scale and main-scale projects will be estimated by considering four key operating costs:
- Plant seeds and nutrients (with Neutralizers)
- Electricity
- Overheads
Since most of these costs have already been estimated, the next step is simply to compile the figures and distribute them across the 75 m² of lettuce production in the pilot-scale setup.
Note: The attached video (also available Here) illustrates the key differences between batch-based lettuce production (pilot scale) and a conveyor belt system (main scale). While batch production is ahead by one complete plant life cycle, this advantage is outweighed by logistical benefits. A continuous daily supply of smaller lettuce increments, rather than a full harvest every 42 days, simplifies sales operations and optimizes storage space. Additionally, using conveyor systems in series allows for dynamic spacing between NFT gutters. Initially, the gutters are placed closely together since young lettuce plants require minimal space. As the conveyor moves forward, the spacing gradually increases, ensuring optimal use of the growing area. In contrast, static batch production requires gutters to be positioned at their maximum spacing from the start, even when the plants are still in the early growth stages. This makes the conveyor system a more space-efficient approach.
10.1 Plant seeds and nutrients
-
The cost of 5000 seed bag of premium Salanova Expertise RZ lettuce is USD 280 , with 33 heads per square meter, the price contribution per m² is USD 1.848.
-
The cost of 250 Rockwool Plugs is USD 10, thus the price per head is $0.04. with 33 heads per m², the contributed cost stands at USD 1.32
-
The cost estimate for of th far end highest quality grade pre-made fertilizer came to $245 for 2,450 Lettuce heads encompassing 75 m², bringing th price per area to USD 3.267.
10.2 Electricity
Total Power Consumption per Hour:
- Each LED light consumes 88 watts.
- Total power for 42 lights:
42 lights × 88 watts = 3,696 watts = 3.696 kW
Daily energy consumption:
- The lights run for 14 hours per day.
- Daily energy consumption:
3.696 kW × 14 hours = 51.744 kWh/day
Total Energy Consumption Over 42 Days
- Total energy consumption:
51.744 kWh/day × 42 days = 2,173.248 kWh
Total Electricity Cost:
- Electricity rate: ₦209.5/kWh.
- Total cost:
2,173.248 kWh × 209.5 ₦/kWh = ₦ 455,295.46
Price per Area = ₦ 6,070.6
10.3 Overheads
The Employee salary above wont chang much since during the main project since these are specialized personnel while the rest of the staff are mostly Labourers or in the security team. for safety purposes, 100% cost shall still be added on top of the current monthly expenditure of ₦ 1,590,000, bringing the sum of salaries per month to ₦ 3,180,000 or per a complete cycle (48 days) to ₦ 5,088,000.
- The are used here will be the total area of the main project mentioned above at 25,000 m²
Price per Area (scaled)= ₦ 203.52
10.4 Summary
| Section | Sub-Section | Cost per m² | |
|---|---|---|---|
| USD ($) | NGN (₦) | ||
| Plant seeds and nutrients | Premium Salanova Expertise RZ seeds | 1.848 | - |
| Rockwool Plugs | 1.32 | - | |
| Premium Fertilizer | 3.267 | - | |
| Electicity | Kedco | - | 6,070.6 |
| Overheads | Salaries | - | 203.52 |
| Total | 6.435 | 6,274.12 | |
- With the current Exchange rate of 1,500 as of the time of writing,the total NGN cost per m² stands at ₦ 15,926.62, or ₦ 482.62 per Lettuce head.
- on the other end, during production when we are fully reliant on solar energy, the Electricity bill could very well be nill, and with our own fertilizer mixture at 5x lower in terms of cost, final cost per m² will become ₦ 5,935.62, or ₦ 179.87 per Premium Lettuce head.
10.5 Projections
- with a base cost of ₦ 179.87 per Lettuce head, adding a redundancy of 25% for Logistics and maintenance, we arrive at a usable cost estimate of ₦224.8 per head.
- The retail price of local lettuce varies at about ₦500, with retail atr about ₦400. lets assume the company is willing to sell our premium product at the same retail price so we can penetrate the market, profit is about ₦175.2 or 43.8%.
- The large scales total conveyor system is Exactly 25,000 m² with a daily production of 1,240 NFT gutters and 33 heads per gutter thus the total profit per month is ₦215,075,520 or $143,383.68.
11.0 Summary of Total Costs
| Section | Details | USD ($) | NGN (₦) |
|---|---|---|---|
| Building Structure | main structure | - | 62,909,300 |
| furniture and utility | - | 6,021,000 | |
| Nutrient Delivery System | Sensors and Actuators Fixed costs | 8,058 | - |
| Sensors and Actuators with Tradeoffs | 10,540 | - | |
| Stainless steel tank construction | - | 2,437,000 | |
| Reverse Osmosis System | - | 4,000,000 | |
| Gutter Framework | vertical farm Gutters unit | - | 11,386,000 |
| HVAC System | 11,824 | - | |
| Specialized Lighting | 21,494 | - | |
| Employees | - | 7,000,000 | |
| Nutrient solution compounds | 670 | - | |
| Total | 52,586 | 93,753,300 |
- With the current Exchange rate of 1,500 as of the time of writing, the Grand Total is thus **$115,088**
12.0 Conclusion
This budget report provides a detailed breakdown of the costs associated with the vertical farm pilot study. The proposed systems and structures are designed to ensure efficiency, durability, and scalability. The next steps involve finalizing the budget, securing funding, and proceeding with the construction and implementation of the pilot study.